 Back
BackBusiness Fluctuations: Aggregate Demand and Supply – Study Notes
Study Guide - Smart Notes
 Tailored notes based on your materials, expanded with key definitions, examples, and context.
Business Fluctuations: Aggregate Demand and Supply
Introduction to Business Fluctuations
Economic growth is not a smooth, uninterrupted process. Instead, economies experience periods of rapid growth (booms) and periods of decline (recessions). Understanding these fluctuations is crucial for macroeconomic analysis and policy-making.
Business fluctuations: Variations in the growth rate of real GDP around its long-term trend.
Recession: A significant, widespread decline in real income and employment.
Policymakers are especially concerned with recessions due to their impact on unemployment and overall economic well-being.
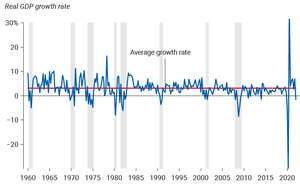
The graph above shows the quarterly growth rate of real GDP in the U.S. from 1960 to 2022, highlighting the volatility around the average growth rate.
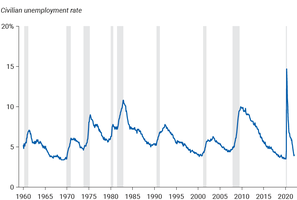
This graph illustrates the U.S. civilian unemployment rate over the same period, showing spikes during recessions.
The Aggregate Demand and Aggregate Supply (AD–AS) Model
The AD–AS model is a fundamental tool for analyzing macroeconomic fluctuations. It consists of three main curves:
Aggregate demand (AD) curve
Long-run aggregate supply (LRAS) curve
Short-run aggregate supply (SRAS) curve
This model demonstrates how unexpected economic disturbances, or "shocks," can temporarily alter the rate of economic growth and inflation.
The Aggregate Demand Curve
Definition and Derivation
The aggregate demand curve shows all combinations of inflation and real GDP growth that are consistent with a given rate of spending growth. It is derived from the dynamic quantity theory of money:
Formula:
For example, if money growth is 5%, velocity growth is 0%, and real growth is 3%, then inflation is 2%.
Any combination of inflation and real growth that sums to the same total is on the same AD curve.
The AD curve typically has a slope of –1, meaning a 1 percentage point increase in real growth reduces inflation by 1 percentage point.
Shifts in the Aggregate Demand Curve
Changes in spending growth, due to changes in the money supply or velocity, shift the AD curve:
Increased spending growth shifts AD up and to the right.
Decreased spending growth shifts AD inward (down and to the left).
The Long-Run Aggregate Supply Curve (LRAS)
Definition and Properties
The LRAS curve represents the economy's potential growth rate, determined by real factors such as labor, capital, and productivity. This rate is called the Solow growth rate:
Solow growth rate: The rate of economic growth that would occur with flexible prices and existing real factors of production.
The LRAS curve is vertical at the Solow growth rate, indicating that potential growth does not depend on the inflation rate.
Shifts in the LRAS Curve
Real shocks—such as wars, technological changes, or major regulatory shifts—can move the LRAS curve:
Positive shocks (e.g., new technology) shift LRAS right (higher potential growth).
Negative shocks (e.g., natural disasters, higher taxes) shift LRAS left (lower potential growth).
Real Shocks
Examples and Economic Impact
Real shocks are rapid changes in economic conditions that affect the productivity of capital and labor, influencing GDP and employment.
Weather shocks can significantly impact agricultural economies, but their importance declines as economies diversify.
Oil shocks are particularly influential in economies with large manufacturing sectors. A reduction in oil supply reduces GDP by making capital and labor less productive.
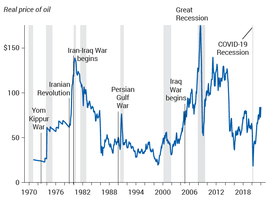
The graph above shows that spikes in oil prices often precede or coincide with U.S. recessions.
Aggregate Demand Shocks and the Short-Run Aggregate Supply Curve
Short-Run Aggregate Supply (SRAS) Curve
The SRAS curve shows the positive relationship between inflation and real growth when prices and wages are sticky. It is upward sloping because:
In the short run, an increase in AD raises both inflation and real growth.
In the short run, a decrease in AD lowers both inflation and real growth.
Each SRAS curve is associated with a particular expected inflation rate .
Aggregate Demand Shocks
Aggregate demand shock: A rapid and unexpected shift in the AD curve (spending).
In the short run, a positive AD shock increases both inflation and real growth; a negative AD shock decreases both.
In the long run, real growth returns to the Solow rate, and only inflation is affected by changes in AD.
Nominal Wage Confusion and Menu Costs
Menu costs: The costs associated with changing prices.
Nominal wage confusion: When workers respond to changes in their nominal wage rather than their real wage (adjusted for inflation).
Shocks to the Components of Aggregate Demand
Changes in the growth rate of spending can be broken down into changes in the growth rates of consumption (C), investment (I), government spending (G), or net exports (NX). These changes tend to be temporary, and the shares of GDP devoted to each component are usually stable over time.
Major Economic Events: The Great Recession and COVID-19 Recession
The Great Recession (2007–2009)
Triggered by a run on the shadow banking system, which was heavily involved in subprime lending and not insured by the FDIC.
Uncertainty about exposure to bad loans led to a credit freeze and a sharp decline in aggregate demand, causing a deep recession.
The COVID-19 Pandemic and Recession (2020)
The pandemic reduced labor and capital productivity, shifting the LRAS curve to the left.
Aggregate demand also fell as spending on many activities declined.
Relief and stimulus programs later increased aggregate demand, raising growth above the long-run level and sharply increasing inflation.
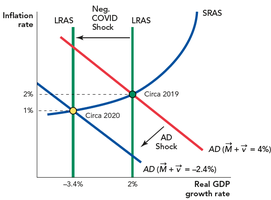
The diagram above illustrates the effects of negative real shocks (leftward shift of LRAS) and aggregate demand shocks during the COVID-19 recession.
Summary and Takeaways
The AD–AS model is essential for analyzing fluctuations in real GDP growth.
Real shocks shift the LRAS curve, while aggregate demand shocks shift the AD curve.
Sticky wages and prices, menu costs, and nominal wage confusion contribute to the upward slope of the SRAS curve.
Major recessions, such as the Great Depression, Great Recession, and COVID-19 recession, can be analyzed using the AD–AS framework.
