 Back
BackChapter 11 Study Guide: Aggregate Supply, Aggregate Demand, and Macroeconomic Equilibrium
Study Guide - Smart Notes
 Tailored notes based on your materials, expanded with key definitions, examples, and context.
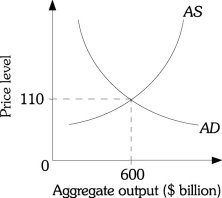
Q1. What is the graph that shows the relationship between the aggregate quantity of output supplied by all the firms in an economy and the overall price level?
Background
Topic: Aggregate Supply and Demand
This question tests your understanding of the main macroeconomic graphs used to analyze the economy, specifically the aggregate supply curve.
Key Terms:
Aggregate Supply (AS): The total quantity of goods and services that firms in an economy are willing and able to produce at different price levels.
Aggregate Demand (AD): The total quantity of goods and services demanded across all levels of price in an economy.
Price Level: A measure of the average prices of goods and services in an economy.
Step-by-Step Guidance
Recall that macroeconomics uses several key graphs: the aggregate supply curve, aggregate demand curve, and production possibilities frontier.
Think about which graph specifically shows the relationship between the total output supplied and the price level.
Review the definitions of each curve and what they represent in the context of the whole economy.
Try solving on your own before revealing the answer!
Q2. Between the output levels of $500 billion and $1,000 billion, what is the relationship between the price level and output?
Background
Topic: Aggregate Supply Curve Slope
This question is about interpreting the slope of the aggregate supply curve between two output levels.
Key Terms:
Aggregate Supply Curve: Shows how much output firms are willing to supply at each price level.
Slope: Indicates whether the relationship is positive, negative, or constant.
Step-by-Step Guidance
Examine the aggregate supply curve between $500 billion and $1,000 billion on the graph.
Observe whether the price level increases, decreases, or stays the same as output increases.
Determine if the relationship is positive (both increase), negative (one increases, the other decreases), or constant (no change).
Try solving on your own before revealing the answer!
Q3. At what output level does this economy reach capacity?
Background
Topic: Capacity Output
This question tests your ability to identify the maximum sustainable output (capacity) from an aggregate supply graph.
Key Terms:
Capacity Output: The highest level of output the economy can sustain without inflationary pressure.
Aggregate Supply Curve: Used to identify capacity output.
Step-by-Step Guidance
Look for the point on the aggregate supply curve where it becomes vertical or sharply increases.
Identify the output level at this point, which represents the economy's capacity.
Compare this output level to the options given in the question.
Try solving on your own before revealing the answer!
Q4. At aggregate output levels below $500 billion, what is the economy most likely experiencing?
Background
Topic: Economic Capacity and Output
This question asks you to interpret what happens when output is below a certain threshold, using the aggregate supply curve.
Key Terms:
Excess Capacity: When the economy is producing below its potential.
Boom: When output is above potential.
Excess Demand: When demand exceeds supply.
Step-by-Step Guidance
Consider what it means for output to be below $500 billion in terms of resource utilization.
Think about whether the economy is underusing its resources (excess capacity) or experiencing high demand.
Use the aggregate supply curve to support your reasoning.
Try solving on your own before revealing the answer!
Q5. What determines the slope of the aggregate supply curve?
Background
Topic: Aggregate Supply Curve Determinants
This question is about the factors that influence how steep or flat the aggregate supply curve is.
Key Terms:
Factors of Production: Inputs like labor, capital, and raw materials.
Price Level: The average level of prices in the economy.
Step-by-Step Guidance
Recall that the slope of the aggregate supply curve depends on how quickly input prices adjust to changes in the overall price level.
Consider the responsiveness of wages and other costs to price changes.
Think about how this affects the ability of firms to increase output.
Try solving on your own before revealing the answer!
Q6. Which equation represents equilibrium in the goods market?
Background
Topic: Goods Market Equilibrium
This question tests your knowledge of the equation that defines equilibrium in the goods market.
Key Terms and Formulas:
Aggregate Expenditure (AE): Total spending in the economy.
Equilibrium: When total spending equals total output.
Step-by-Step Guidance
Recall the components of aggregate expenditure: consumption (C), investment (I), and government spending (G).
Identify the equation that sets aggregate expenditure equal to output for equilibrium.
Compare the options to see which matches the standard macroeconomic equilibrium equation.
Try solving on your own before revealing the answer!
Q7. Which curve represents the relationship where, as the price level falls, consumers and firms buy more goods and services?
Background
Topic: Aggregate Demand Curve
This question is about identifying the curve that shows the inverse relationship between price level and quantity demanded.
Key Terms:
Aggregate Demand Curve: Shows how total spending changes as the price level changes.
Price Level: Average prices in the economy.
Step-by-Step Guidance
Recall that the aggregate demand curve slopes downward, indicating that lower prices lead to higher demand.
Identify which curve in macroeconomics represents this relationship.
Review the definitions of the aggregate supply and demand curves.
Try solving on your own before revealing the answer!
Q8. The aggregate demand curve shows a ________ relationship between ________ and total quantity of output ________.
Background
Topic: Aggregate Demand Curve Slope
This question tests your understanding of the direction of the relationship between price level and output demanded.
Key Terms:
Negative Relationship: As one variable increases, the other decreases.
Aggregate Demand Curve: Shows the relationship between price level and output demanded.
Step-by-Step Guidance
Recall that the aggregate demand curve slopes downward.
Think about what happens to output demanded as the price level rises or falls.
Match the correct relationship to the options given.
Try solving on your own before revealing the answer!
Q9. What happens to the aggregate demand curve when government purchases increase?
Background
Topic: Fiscal Policy and Aggregate Demand
This question tests your understanding of how government spending affects aggregate demand.
Key Terms:
Aggregate Demand Curve: Total spending in the economy at different price levels.
Government Purchases: Component of aggregate demand.
Step-by-Step Guidance
Recall that government spending is a direct component of aggregate demand.
Think about how an increase in government purchases affects total demand.
Determine whether the aggregate demand curve shifts left or right.
Try solving on your own before revealing the answer!
Q10. What is the sequence of events following an open market purchase by the Fed?
Background
Topic: Monetary Policy Transmission
This question tests your understanding of how monetary policy affects interest rates, investment, aggregate expenditure, and output.
Key Terms:
Open Market Purchase: The Fed buys government securities, increasing money supply.
Interest Rate (r): Cost of borrowing money.
Investment (I): Spending on capital goods.
Aggregate Expenditure (AE): Total spending in the economy.
Output (Y): Total production in the economy.
Step-by-Step Guidance
Recall that an open market purchase increases the money supply.
Think about how this affects interest rates (r).
Consider the impact on investment (I), aggregate expenditure (AE), and output (Y).
Try solving on your own before revealing the answer!
Q11. What would an oil embargo likely do to equilibrium output and price level?
Background
Topic: Supply Shocks and Macroeconomic Equilibrium
This question tests your understanding of how negative supply shocks (like an oil embargo) affect output and price level.
Key Terms:
Oil Embargo: Sudden reduction in oil supply.
Equilibrium Output: Where aggregate supply and demand intersect.
Price Level: Average prices in the economy.
Step-by-Step Guidance
Recall that an oil embargo increases production costs, shifting the aggregate supply curve left.
Think about how this affects equilibrium output and price level.
Use the graph to visualize the changes.
Try solving on your own before revealing the answer!
Q12. What happens to equilibrium output and price level if wages decrease and government spending increases?
Background
Topic: Aggregate Supply and Demand Shifts
This question tests your understanding of how changes in wages and government spending affect macroeconomic equilibrium.
Key Terms:
Wages: Cost of labor, affects aggregate supply.
Government Spending: Component of aggregate demand.
Equilibrium Output: Intersection of AS and AD.
Step-by-Step Guidance
Recall that a decrease in wages lowers production costs, shifting aggregate supply right.
Think about how an increase in government spending shifts aggregate demand right.
Consider the combined effect on equilibrium output and price level.
Try solving on your own before revealing the answer!
Q13. What would an increase in the supply of oil likely do to equilibrium output and price level?
Background
Topic: Positive Supply Shocks
This question tests your understanding of how an increase in oil supply affects the economy.
Key Terms:
Supply Shock: Sudden change in availability of a key input.
Aggregate Supply Curve: Shifts right with increased supply.
Step-by-Step Guidance
Recall that an increase in oil supply lowers production costs, shifting aggregate supply right.
Think about how this affects equilibrium output and price level.
Use the graph to visualize the changes.
Try solving on your own before revealing the answer!
Q14. To decrease the price level, what policies could the government adopt?
Background
Topic: Policy Tools and Price Level
This question tests your understanding of how government policies can affect the price level.
Key Terms:
Immigration Policy: Affects labor supply.
Government Spending: Affects aggregate demand.
Technological Advancement: Affects aggregate supply.
Step-by-Step Guidance
Recall that decreasing government spending reduces aggregate demand, lowering the price level.
Encouraging immigration increases labor supply, potentially lowering production costs.
Consider how these policies interact to affect the price level.
Try solving on your own before revealing the answer!
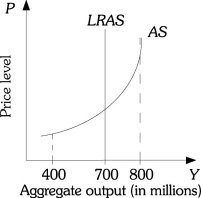
Q21. What is potential output according to the graph?
Background
Topic: Long-Run Aggregate Supply and Potential Output
This question tests your ability to identify potential output from a graph showing the long-run aggregate supply curve.
Key Terms:
Potential Output: The level of output the economy can sustain in the long run without inflation.
Long-Run Aggregate Supply (LRAS): Vertical line at potential output.
Step-by-Step Guidance
Locate the LRAS curve on the graph.
Identify the output level where LRAS is drawn.
Compare this output level to the options given.
Try solving on your own before revealing the answer!
Q22. What is the level of aggregate output that can be sustained in the long run without inflation?
Background
Topic: Long-Run Aggregate Supply and Inflation
This question tests your understanding of the concept of potential output and its relationship to inflation.
Key Terms:
Potential Output: Maximum sustainable output without inflation.
Long-Run Aggregate Supply (LRAS): Indicates potential output.
Step-by-Step Guidance
Recall that potential output is where the LRAS curve is vertical.
Identify the output level on the graph corresponding to LRAS.
Compare this output level to the options given.
Try solving on your own before revealing the answer!
