 Back
BackChapter 3: Where Prices Come From – The Interaction of Demand and Supply
Study Guide - Smart Notes
 Tailored notes based on your materials, expanded with key definitions, examples, and context.
Where Prices Come From: The Interaction of Demand and Supply
Introduction
This chapter explores how prices are determined in markets through the interaction of demand and supply. It introduces the foundational economic model of a perfectly competitive market and examines the factors that influence both buyers and sellers. The chapter also analyzes how shifts in demand and supply affect market equilibrium, price, and quantity.
The Demand Side of the Market
Market Demand and the Law of Demand
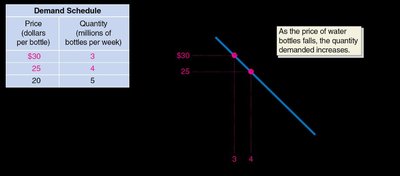
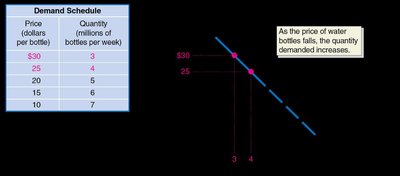
Market demand refers to the total demand by all consumers for a given good or service. The law of demand states that, holding everything else constant, when the price of a product falls, the quantity demanded increases, and when the price rises, the quantity demanded decreases.
Demand schedule: A table showing the relationship between the price of a product and the quantity demanded.
Demand curve: A graphical representation of the demand schedule, showing the relationship between price and quantity demanded.
Quantity demanded: The amount of a good or service that a consumer is willing and able to purchase at a given price.
Explaining the Law of Demand: Substitution and Income Effects
Substitution effect: When the price of a good falls, consumers substitute toward the cheaper good, increasing quantity demanded.
Income effect: A lower price increases consumers' purchasing power, allowing them to buy more.
Ceteris paribus: The assumption that all other variables are held constant when analyzing the relationship between price and quantity demanded.
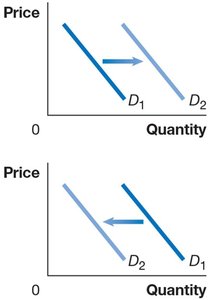
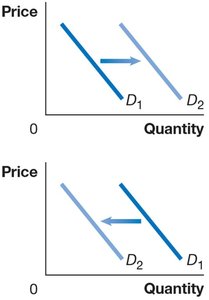
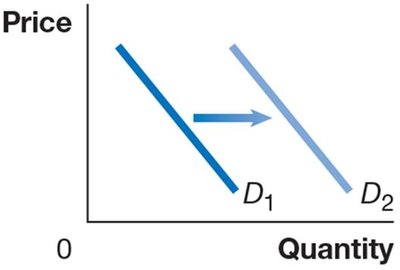
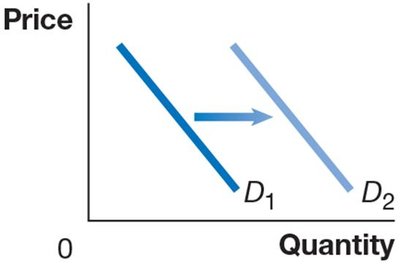
Shifts in the Demand Curve
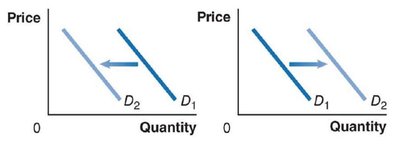
A change in a variable other than price causes the entire demand curve to shift. A shift to the right indicates an increase in demand; a shift to the left indicates a decrease.
Change in demand: The entire demand curve shifts due to factors other than price.
Change in quantity demanded: Movement along the demand curve due to a change in price.
Variables That Shift Market Demand
Income: Demand for normal goods increases as income rises; demand for inferior goods increases as income falls.
Prices of related goods: Substitutes and complements affect demand. An increase in the price of a substitute increases demand; an increase in the price of a complement decreases demand.
Tastes: Changes in consumer preferences can increase or decrease demand.
Population and demographics: Changes in the size and composition of the population affect demand.
Expected future prices: If consumers expect prices to rise, current demand increases; if they expect prices to fall, current demand decreases.
Natural disasters and pandemics: Temporary disruptions can shift demand for certain goods and services.
Normal and Inferior Goods
Normal good: Demand increases as income rises (e.g., new clothes, restaurant meals).
Inferior good: Demand increases as income falls (e.g., second-hand clothes, instant noodles).
Substitutes and Complements
Substitutes: Goods used for the same purpose (e.g., Big Mac and Whopper).
Complements: Goods used together (e.g., left and right shoes).
Changes in Tastes
Influencer marketing or social trends can shift demand for products (e.g., reusable water bottles).
Population and Demographics
Demographic changes, such as an aging population, can increase demand for specific goods (e.g., medical care).

Expectations About Future Prices
Anticipated price increases boost current demand; anticipated price decreases reduce current demand.
Natural Disasters and Pandemics
Events like pandemics can decrease demand for some goods (e.g., restaurants) and increase demand for others (e.g., home office equipment).
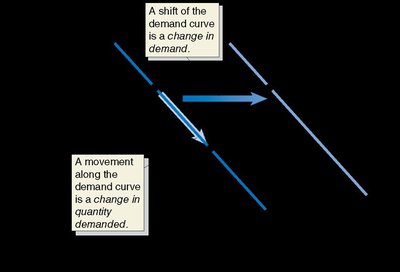
Change in Demand vs. Change in Quantity Demanded
A price change causes movement along the demand curve (change in quantity demanded).
Other factors shift the entire demand curve (change in demand).
The Supply Side of the Market
Market Supply and the Law of Supply
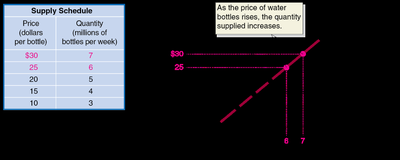
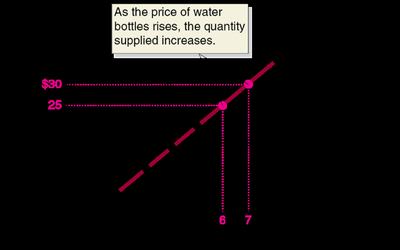
Market supply refers to the total quantity of a good or service that firms are willing and able to sell at various prices. The law of supply states that, holding everything else constant, increases in price cause increases in the quantity supplied, and decreases in price cause decreases in the quantity supplied.
Supply schedule: A table showing the relationship between the price of a product and the quantity supplied.
Supply curve: A graphical representation of the supply schedule.
Quantity supplied: The amount of a good or service that a firm is willing and able to supply at a given price.
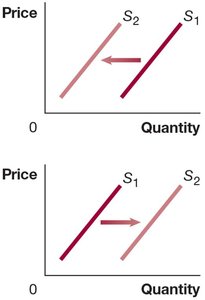
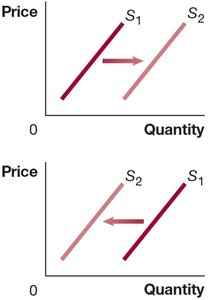
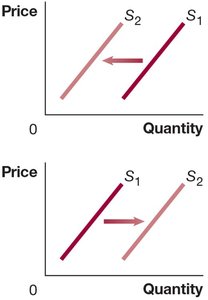
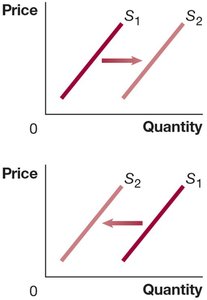
Shifts in the Supply Curve
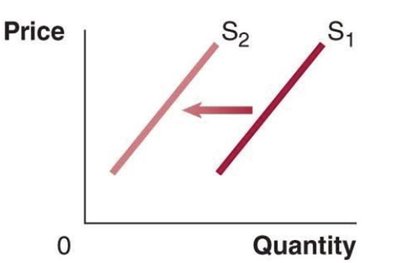
A change in a variable other than price causes the entire supply curve to shift. A shift to the right indicates an increase in supply; a shift to the left indicates a decrease.
Change in supply: The entire supply curve shifts due to factors other than price.
Change in quantity supplied: Movement along the supply curve due to a change in price.
Variables That Shift Market Supply
Prices of inputs: Higher input prices decrease supply; lower input prices increase supply.
Technological change: Improvements in technology increase supply; negative changes decrease supply.
Prices of related goods in production: If the price of a substitute in production rises, supply of the original good decreases; if the price of a complement rises, supply increases.
Number of firms: More firms increase supply; fewer firms decrease supply.
Expected future prices: If firms expect higher future prices, they may decrease current supply.
Natural disasters and pandemics: Disruptions reduce supply.
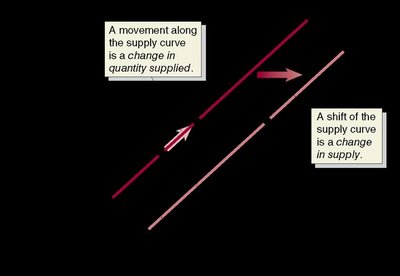
Change in Supply vs. Change in Quantity Supplied
A price change causes movement along the supply curve (change in quantity supplied).
Other factors shift the entire supply curve (change in supply).
Market Equilibrium: Putting Demand and Supply Together
Market Equilibrium
Market equilibrium occurs when quantity demanded equals quantity supplied. The equilibrium price is the price at which this occurs, and the equilibrium quantity is the amount bought and sold at this price.
Competitive market equilibrium: The equilibrium in a market with many buyers and sellers.
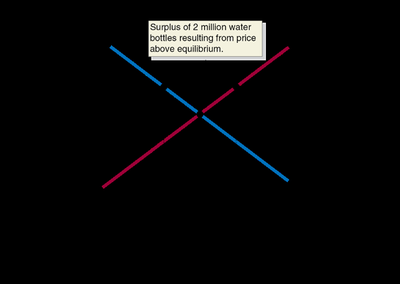
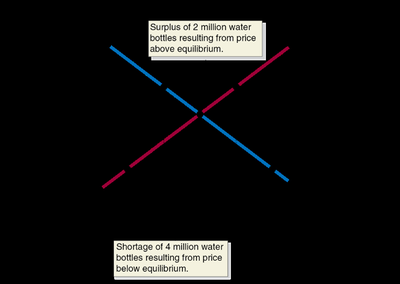
Surpluses and Shortages
Surplus: Quantity supplied exceeds quantity demanded at a given price; leads to downward pressure on price.
Shortage: Quantity demanded exceeds quantity supplied at a given price; leads to upward pressure on price.
The Effect of Demand and Supply Shifts on Equilibrium
Predicting Changes in Price and Quantity
Shifts in demand and/or supply curves change the equilibrium price and quantity. The direction of change depends on which curve shifts and by how much.
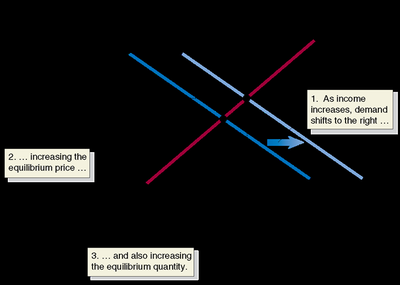
Increase in demand: Raises both equilibrium price and quantity.
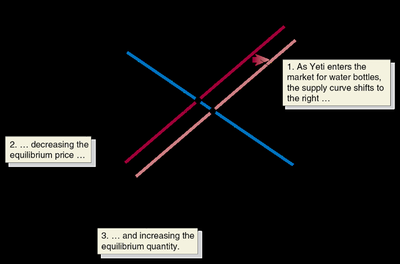
Increase in supply: Lowers equilibrium price and raises equilibrium quantity.
Simultaneous shifts: The effect on equilibrium price is ambiguous without knowing the relative size of the shifts, but equilibrium quantity will rise if both curves shift right.
Summary Table: Effects of Shifts in Demand and Supply
Supply Curve Unchanged | Supply Curve Shifts to the Right | Supply Curve Shifts to the Left | |
|---|---|---|---|
Demand Curve Unchanged | Q unchanged P unchanged | Q increases P decreases | Q decreases P increases |
Demand Curve Shifts to the Right | Q increases P increases | Q increases P increases, decreases, or unchanged | Q increases, decreases, or unchanged P increases |
Demand Curve Shifts to the Left | Q decreases P decreases | Q increases, decreases, or unchanged P decreases | Q decreases P increases, decreases, or unchanged |
Shifts of a Curve vs. Movements Along a Curve
A shift in supply or demand changes equilibrium; a movement along a curve is a response to a price change, not a shift in the curve itself.
For example, an increase in supply lowers price and increases quantity demanded, but this is a movement along the demand curve, not a shift.
Key Equations
Demand function (linear):
Supply function (linear):
Equilibrium condition:
Example Application: Used Car Market
In 2020, supply shortages for new cars increased demand for used cars, while rental car companies reduced their fleets, decreasing supply. Both effects increased prices for used cars.
Additional info: This chapter provides the foundation for understanding how markets allocate resources and set prices, which is essential for further study in macroeconomics.
