 Back
BackComparative and Absolute Advantage, Opportunity Cost, and PPF Analysis
Study Guide - Smart Notes
 Tailored notes based on your materials, expanded with key definitions, examples, and context.
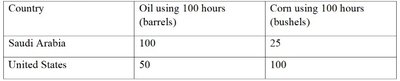
Q1. Using the table, answer the following:
What is Saudi Arabia’s opportunity cost of producing 1 barrel of oil? 1 bushel of corn?
What is the United States’ opportunity cost of producing 1 barrel of oil? 1 bushel of corn?
Who has the absolute advantage in oil production?
Who has the absolute advantage in corn production?
Who has the comparative advantage in oil production?
Who has the comparative advantage in corn production?
Background
Topic: Comparative and Absolute Advantage, Opportunity Cost, and Gains from Trade
This question tests your understanding of how to calculate opportunity costs, identify absolute and comparative advantage, and apply these concepts to international trade scenarios using production data.
Key Terms and Formulas
Opportunity Cost: The value of the next best alternative forgone when making a choice.
Absolute Advantage: The ability to produce more of a good with the same resources.
Comparative Advantage: The ability to produce a good at a lower opportunity cost than another producer.
Key Formulas:
Opportunity cost of Good A = (Units of Good B forgone) / (Units of Good A produced)
Step-by-Step Guidance
Start by identifying the maximum output for each country using 100 worker hours: Saudi Arabia can produce 100 barrels of oil or 25 bushels of corn; United States can produce 50 barrels of oil or 100 bushels of corn.
Calculate Saudi Arabia’s opportunity cost of producing 1 barrel of oil. Use the formula: .
Calculate Saudi Arabia’s opportunity cost of producing 1 bushel of corn. Use the formula: .
Repeat steps 2 and 3 for the United States, using their production numbers.
Determine absolute advantage by comparing which country produces more of each good with the same resources.
Determine comparative advantage by comparing opportunity costs for each good between the two countries.
Try solving on your own before revealing the answer!
Q2. Use the information from Question 1. Graph the Production Possibilities Frontier for both countries.
Background
Topic: Production Possibilities Frontier (PPF)
This question tests your ability to graphically represent the trade-offs between two goods for each country, illustrating opportunity cost and efficiency.
Key Terms and Formulas
Production Possibilities Frontier (PPF): A curve showing the maximum attainable combinations of two products that may be produced with available resources and technology.
Key Formula:
For a straight-line PPF: endpoints are the maximum outputs of each good (from the table).
Step-by-Step Guidance
For Saudi Arabia, plot the endpoints: (100, 0) for oil and (0, 25) for corn.
For United States, plot the endpoints: (50, 0) for oil and (0, 100) for corn.
Draw a straight line connecting the endpoints for each country. This represents their PPF.
Label each axis: Oil (barrels) on one axis, Corn (bushels) on the other.
Try solving on your own before revealing the answer!
