 Back
BackConsumer and Firm Behavior: The Work-Leisure Decision and Profit Maximization
Study Guide - Smart Notes
 Tailored notes based on your materials, expanded with key definitions, examples, and context.
Consumer and Firm Behavior: The Work-Leisure Decision and Profit Maximization
Introduction to Macroeconomic Modeling
This chapter introduces the foundational concepts of macroeconomic modeling by examining the behavior of consumers and firms in a one-period, static setting. The focus is on how individuals make choices between consumption and leisure, and how firms decide on production and labor hiring to maximize profits. These micro-level decisions underpin aggregate macroeconomic outcomes.
Consumer Behavior: The Work-Leisure Tradeoff
Consumer Preferences and Assumptions
Consumers aim to maximize their well-being by choosing between consumption and leisure. Their decisions are influenced by preferences and constraints such as income and available time.
More is preferred to less: Consumers always prefer bundles with more consumption and/or more leisure.
Diversity: Consumers value a mix of consumption and leisure rather than extremes.
Normal goods: Both consumption and leisure are normal goods, meaning their demand increases as income rises.
Utility Function and Indifference Curves
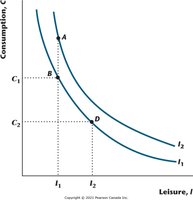
The utility function represents consumer preferences over combinations of consumption (C) and leisure (l). Indifference curves show all combinations of C and l that yield the same utility.
Higher indifference curves represent higher utility levels.
Consumers are indifferent between any two points on the same curve.
Indifference curves are typically downward sloping and convex to the origin.
Properties of Indifference Curves
Indifference curves do not cross.
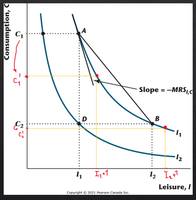
The slope at any point is the marginal rate of substitution (MRS), representing the rate at which the consumer is willing to trade leisure for consumption.
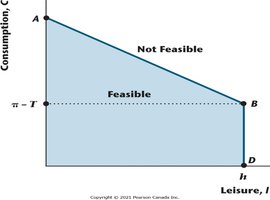
Constraints Facing the Consumer
Consumers face two main constraints:
Time constraint: Total available time (h) must be allocated between leisure (l) and labor (Ns), so h = l + N^s.
Budget constraint: Consumption is limited by wage income and nonwage income (such as dividends or taxes):
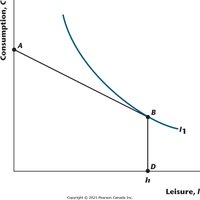
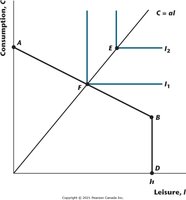
Consumer Optimization
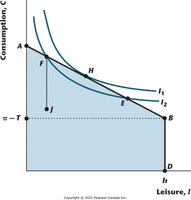
The optimal choice for the consumer is the point where the highest attainable indifference curve is tangent to the budget constraint. This point represents the best feasible combination of consumption and leisure.
Consumers never choose a point inside the budget constraint, as more is always preferred to less.
The optimal bundle is where the MRS equals the real wage rate.
Special Cases in Consumer Choice
In rare cases, the consumer may choose not to work at all, consuming only nonwage income and enjoying maximum leisure. However, this is inconsistent with equilibrium in the labor market.
Effects of Changes in Income and Wages
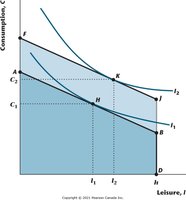
Changes in Nonwage Income (Dividends or Taxes)
An increase in dividends or a decrease in taxes shifts the budget constraint outward, allowing for more consumption and leisure (since both are normal goods).
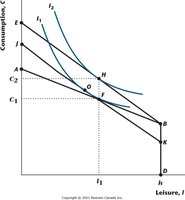
Changes in the Real Wage Rate
Substitution effect: A higher wage makes leisure more expensive, so consumers substitute away from leisure toward more labor (and thus more consumption).
Income effect: A higher wage increases overall wealth, so consumers may choose more leisure and more consumption.
The net effect on leisure is ambiguous, but consumption always rises.
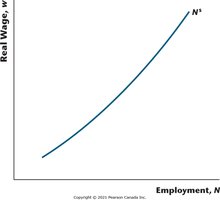
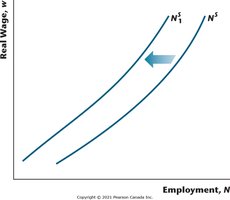
Labour Supply Curve
The labor supply curve shows the relationship between the real wage and the quantity of labor supplied. Its shape depends on the relative strengths of the income and substitution effects.
Shifts in Labour Supply
Increases in nonwage income (e.g., higher dividends or lower taxes) shift the labor supply curve to the left, as consumers supply less labor at each wage.
Perfect Complements Case
If consumption and leisure are perfect complements, indifference curves are L-shaped, and the consumer always chooses bundles where consumption is a fixed multiple of leisure.
Firm Behavior: Production and Profit Maximization
Firm Objectives and Choices
Firms aim to maximize profits by choosing how much to produce and how much labor to hire, given the available technology and market conditions.
Profit = Total Revenue - Total Cost
Key decisions: Output level and labor input
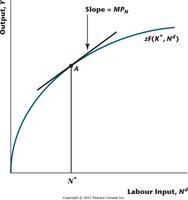
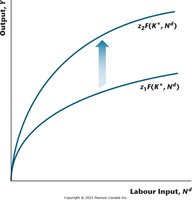
The Production Function
The production function describes the relationship between inputs (labor and capital) and output. It is typically written as:
, where Y is output, z is total factor productivity, K is capital, and Nd is labor input.
Properties of the Production Function
Constant returns to scale: Doubling all inputs doubles output.
Increasing input increases output: More labor or capital increases output.
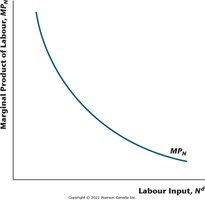
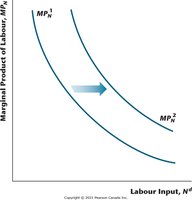
Diminishing marginal product: The marginal product of labor (MPN) decreases as more labor is used, holding capital constant.
Marginal product of capital: Also decreases as more capital is used, holding labor constant.
Marginal product of labor increases with capital: More capital raises the productivity of labor.
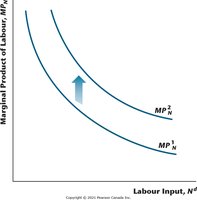
Total Factor Productivity (TFP)
An increase in TFP (z) raises output for any given combination of inputs and increases the marginal product of labor.
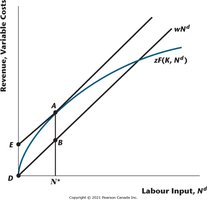
Profit Maximization
Firms maximize profits by hiring labor up to the point where the marginal product of labor equals the real wage:
At this point, the cost of hiring an additional worker equals the value of the output produced by that worker.
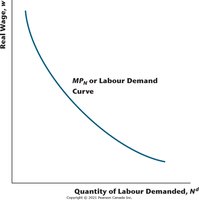
Labour Demand Curve
The marginal product of labor curve is also the firm's labor demand curve. Firms hire labor up to the point where the real wage equals the marginal product of labor.
Summary Table: Key Relationships
Concept | Definition | Key Equation |
|---|---|---|
Budget Constraint | Limits on consumption based on income and time | |
Production Function | Output as a function of labor and capital | |
Profit Maximization | Optimal labor choice for firms | |
Indifference Curve | Combinations of C and l with equal utility | n/a |
