 Back
BackConsumption, Real GDP, and the Multiplier – Keynesian Macroeconomic Analysis
Study Guide - Smart Notes
 Tailored notes based on your materials, expanded with key definitions, examples, and context.
Chapter 11: Consumption, Real GDP, and the Multiplier
11.1 Determinants of Planned Consumption and Planned Saving
This section explores the factors influencing household consumption and saving decisions within the Keynesian framework, focusing on the relationship between disposable income, consumption, and saving.
Real Disposable Income: Defined as real GDP minus net taxes; it represents after-tax income available for spending or saving.
Consumption: Spending on new goods and services from current income. What is not consumed is saved.
Saving: The portion of disposable income not spent on consumption. Saving is a flow (measured over time), while savings are a stock (accumulated savings).
Accounting Identity: Consumption + Saving ≡ Disposable Income Saving ≡ Disposable Income – Consumption
Investment: Business spending on capital goods (machines, buildings) used for future production.
Classical vs. Keynesian Views: The classical model emphasizes the interest rate as the main determinant of saving, while Keynes argued that real disposable income is more important, with expectations about future income also playing a role.
Life-Cycle Theory of Consumption: Individuals base current consumption and saving decisions on both current and anticipated future income.
Consumption Function: Shows the relationship between planned consumption and disposable income.
Dissaving: Occurs when spending exceeds income, often financed by borrowing or using past savings.
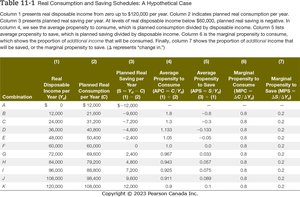
Table Purpose: This table illustrates how real disposable income is allocated between consumption and saving, and calculates average and marginal propensities to consume and save.
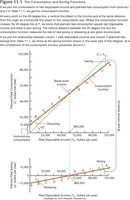
Figure Purpose: This figure visually represents the consumption and saving functions, showing their relationship to the 45-degree reference line where consumption equals disposable income.
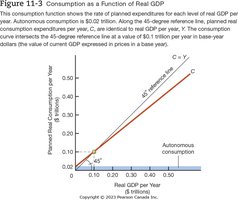
Autonomous Consumption: Consumption independent of disposable income; shifts in autonomous consumption shift the entire consumption function.
Marginal Propensity to Consume (MPC): The ratio of the change in consumption to the change in disposable income.
Marginal Propensity to Save (MPS): The ratio of the change in saving to the change in disposable income.
Key Identity:
Non-Income Determinants of Consumption: Population, net wealth, job security, and other factors can shift the consumption function.
11.2 Determinants of Investment
Investment is a key component of aggregate expenditures, consisting of business spending on capital goods and changes in inventories. The planned investment function describes how investment responds to changes in the interest rate and other factors.
Planned Investment Function: Shows an inverse relationship between the interest rate and planned investment.
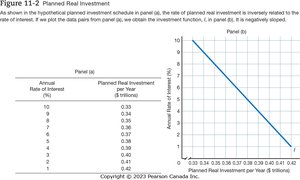
Figure Purpose: Demonstrates the negative relationship between the interest rate and planned investment, and how the investment function can shift due to non-interest factors.
Shifts in the Investment Function: Caused by changes in profit expectations, technology, and business taxes.
11.3 Determining Equilibrium Real GDP
Equilibrium real GDP is established where total planned expenditures equal actual real GDP. The 45-degree reference line is used to identify this equilibrium in graphical models.
Consumption as a Function of Real GDP: The consumption function is plotted against real GDP, with the 45-degree line indicating points where planned expenditures equal output.
Adding Investment: Aggregate demand (AD) in a simple model is the sum of consumption and investment: .
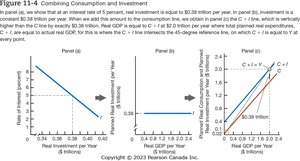
Figure Purpose: Illustrates how adding investment to consumption shifts the planned expenditure line upward, establishing a new equilibrium real GDP.
Shifts in Planned Investment: An increase in planned investment shifts the C + I line upward, raising equilibrium real GDP.
11.4 Keynesian Equilibrium with Government and the Foreign Sector Added
Introducing government spending and the foreign sector expands the model to reflect a more realistic economy. Equilibrium is now determined by the sum of consumption, investment, government spending, and net exports.
Government Spending (G): Autonomous and does not include transfer payments. Aggregate expenditures become .
Foreign Sector (Net Exports, X): Net exports are exports minus imports, also treated as autonomous. Aggregate expenditures become .
Equilibrium Condition: Occurs when (real GDP).
Inventory Adjustments: If planned expenditures exceed output, inventories fall and firms increase production; if planned expenditures are less than output, inventories rise and firms cut production.
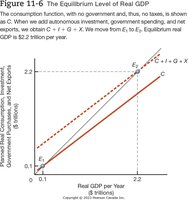
Figure Purpose: Shows how adding government and foreign sector spending shifts the planned expenditure line, raising equilibrium real GDP.
11.5 The Multiplier
The multiplier effect explains how a change in autonomous spending leads to a larger change in equilibrium real GDP. The size of the multiplier depends on the marginal propensities to consume and save.
Multiplier Definition: The ratio of the change in equilibrium real GDP to the change in autonomous real expenditures.
Multiplier Formula:
Key Properties: The smaller the MPS (and the larger the MPC), the larger the multiplier.
Change in Equilibrium Real GDP:
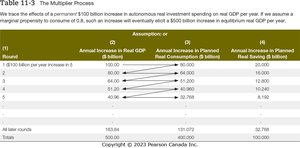
Table Purpose: Demonstrates how an initial increase in investment spending is multiplied through successive rounds of consumption, ultimately resulting in a much larger increase in equilibrium real GDP.
Significance: Small changes in autonomous spending can have large effects on output and income.
11.6 How a Change in Real Autonomous Spending Affects Real GDP When the Price Level Can Change
When the price level is allowed to change, the impact of shifts in autonomous spending on real GDP is moderated by the aggregate supply curve. The aggregate demand (AD) curve reflects the relationship between the price level and real GDP demanded.
Aggregate Demand Components: Consumption, investment, government spending, and net exports.
Difference Between C + I + G + X and AD: The former assumes a constant price level, while the AD curve allows the price level to change.
Effects of a Price Level Increase: Real-balance effect, interest rate effect, and open economy effect reduce the impact of increased autonomous spending on real GDP.
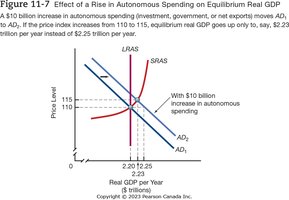
Figure Purpose: Shows how an increase in autonomous spending shifts the AD curve, but the resulting increase in real GDP is less when the price level rises.
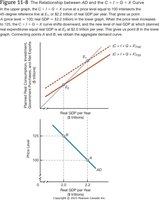
Figure Purpose: Illustrates the derivation of the aggregate demand curve from the planned expenditure model as the price level changes.
Issues & Applications
Saving Trends in Canada: The Canadian savings rate has declined since its peak in 1982, with implications for retirement planning and economic stability.
Investment Volatility: Changes in planned investment are a major source of fluctuations in aggregate expenditures and real GDP, with multiplier effects amplifying these changes.
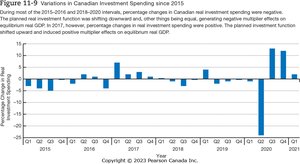
Figure Purpose: Depicts the volatility of Canadian investment spending and its impact on aggregate demand and real GDP.
Additional info: The notes above expand on the brief points in the slides, providing definitions, formulas, and context for each concept. All images included are directly relevant to the adjacent explanations and reinforce the key macroeconomic concepts discussed in Chapter 11.
