 Back
BackCreating an Environment for Growth and Prosperity: Economic Growth, Institutions, and Policy
Study Guide - Smart Notes
 Tailored notes based on your materials, expanded with key definitions, examples, and context.
Economic Growth and Its Importance
Why Economic Growth Matters
Economic growth is a fundamental driver of higher incomes and improved living standards. It is typically measured by increases in Gross Domestic Product (GDP), which reflects the total output and income of a nation. Growth in per capita GDP—GDP divided by the population—indicates that the average person can access more goods and services, leading to better health, longer life expectancy, and greater educational opportunities. Economic growth also enables a cleaner environment and more leisure time.
GDP: The total value of all goods and services produced within a country in a given period.
Per Capita GDP: GDP divided by the population, a measure of average income.
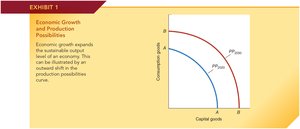
Production Possibilities Curve (PPC): Illustrates the maximum feasible output combinations of two goods that an economy can produce given its resources and technology.
Economic growth is visually represented by an outward shift in the PPC, indicating that more goods and services can be produced.
The Rule of 70
The Rule of 70 is a simple way to estimate the number of years required for a variable to double, given a particular annual growth rate. The formula is:
This rule highlights the power of compounding: even small differences in growth rates can lead to large differences in income over time.
Impact of Growth Rate Differences
Differences in economic growth rates have significant long-term effects on income levels. For example, with an initial per capita income of $10,000, a country growing at 4% annually will have a much higher income after 30 years compared to countries growing at lower rates.
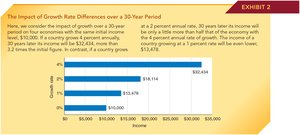
At 0% growth: $10,000
At 1% growth: $13,480
At 2% growth: $18,114
At 4% growth: $32,434
Additional info: This demonstrates the exponential effect of growth rates on long-term prosperity.
Sources of Economic Growth
Gains from Trade
Trade enables economies to achieve larger outputs through the division of labor, specialization in areas of comparative advantage, and mass production. Lower transaction costs and access to larger markets amplify these gains.
Comparative Advantage: The ability to produce a good at a lower opportunity cost than others.
Specialization: Focusing resources on the production of specific goods for greater efficiency.
Investment in Physical and Human Capital
Investment in machinery, tools, education, and training increases worker productivity and output. However, investment requires sacrificing current consumption for future gains. The effectiveness of investment depends on its allocation to wealth-creating projects.
Physical Capital: Tangible assets like machinery and infrastructure.
Human Capital: Skills and knowledge acquired through education and training.
Institutions and Policies Promoting Growth
The Institutional Environment
Modern growth analysis emphasizes the role of institutions and policies in fostering economic growth. Six key elements are identified:
Legal System: Protection of property rights and enforcement of contracts are essential for market efficiency and investment incentives. Insecure property rights, often due to political instability, deter investment and entrepreneurship.
Competitive Markets: Competition incentivizes producers to innovate, reduce costs, and serve consumer interests. Freedom to compete encourages entrepreneurial activity.
Monetary and Price Stability: Stable prices and sound monetary policy reduce uncertainty and promote investment.
Avoidance of Inefficient Regulations: Excessive regulation increases costs and reduces the incentive to innovate and invest.
Avoid High Marginal Tax Rates: High taxes discourage productive activities and can drive economic activity underground or abroad.
Trade Openness: Fewer barriers to trade enhance gains from specialization and access to larger markets.
Economic Freedom and Growth
Measuring Economic Freedom
Economic freedom is characterized by secure property rights, contract enforcement, stable monetary policy, low taxes, open trade, and reliance on markets. The Economic Freedom of the World (EFW) index measures these factors.
High EFW ratings are associated with higher incomes, faster growth, lower poverty, longer life expectancy, and better environmental quality.
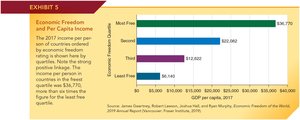
Economic Freedom and Income
Countries with higher economic freedom have significantly higher per capita incomes. For example, in 2017, the most free quartile had an average per capita income of $36,770, compared to $10,781 in the least free quartile.
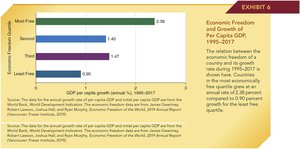
Economic Freedom and Growth Rates
From 1995 to 2017, countries in the most free quartile experienced an average annual per capita GDP growth rate of 2.38%, compared to 0.9% in the least free quartile.
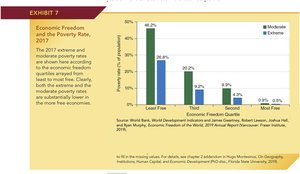
Economic Freedom and Poverty
Poverty rates are much lower in economically free countries. In 2017, the extreme poverty rate was 0.5% in the most free quartile, versus 26.8% in the least free quartile.
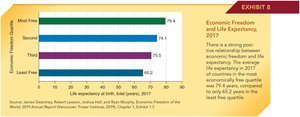
Economic Freedom and Life Expectancy
Life expectancy is higher in countries with greater economic freedom. In 2017, the most free countries had an average life expectancy of 79.4 years, compared to 65.2 years in the least free countries.
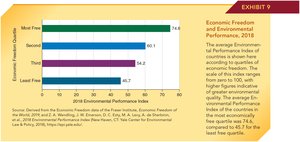
Economic Freedom and Environmental Quality
Environmental quality, as measured by the Environmental Performance Index, is higher in more economically free countries. In 2018, the most free countries scored 74.6, while the least free scored 45.7.
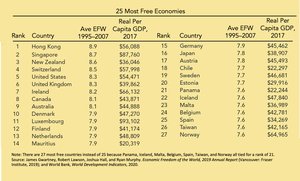
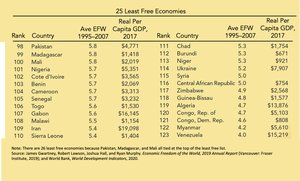
Cross-Country Comparisons
Tables of the most and least free economies show a strong correlation between economic freedom and per capita GDP. All of the most free economies had per capita GDP above $20,000 in 2017, while none of the least free economies reached this threshold (except for a few oil exporters).
Summary Table: Key Institutional Factors and Economic Outcomes
Institutional Factor | Effect on Growth | Effect on Income | Effect on Poverty | Effect on Life Expectancy | Effect on Environment |
|---|---|---|---|---|---|
Property Rights & Legal System | Promotes investment & innovation | Higher | Lower | Higher | Better |
Competitive Markets | Encourages efficiency & entrepreneurship | Higher | Lower | Higher | Better |
Monetary Stability | Reduces uncertainty | Higher | Lower | Higher | Better |
Low Taxes & Regulation | Increases incentives | Higher | Lower | Higher | Better |
Trade Openness | Expands markets & gains from trade | Higher | Lower | Higher | Better |
Additional info: This table summarizes the positive associations between sound institutions and various measures of economic performance.
