 Back
BackDemand and Supply: Foundations of Market Equilibrium
Study Guide - Smart Notes
 Tailored notes based on your materials, expanded with key definitions, examples, and context.
Demand and Supply
Introduction
Understanding how markets function is central to macroeconomics. This chapter explores the fundamental concepts of demand and supply, the forces that determine prices and quantities in markets. Through real-world examples and graphical analysis, we examine how buyers and sellers interact to reach equilibrium, and how shifts in market conditions affect outcomes.
Demand
Definition and Law of Demand
Demand: A schedule showing the quantities of a good or service that consumers are willing and able to purchase at various prices during a specified period, holding other factors constant.
Law of Demand: There is an inverse relationship between the price of a good and the quantity demanded, ceteris paribus (all else equal). As price increases, quantity demanded decreases, and vice versa.
Ceteris Paribus: Factors held constant include income, tastes and preferences, prices of other goods, and more.
Relative Price vs. Money Price
Relative Price: The price of one good in terms of another good (e.g., how many units of good A must be given up to buy one unit of good B).
Money Price: The absolute price of a good in currency terms (e.g., dollars).
Example: If the money price of electricity rises faster than the average price level, its relative price increases, making it more expensive compared to other goods.
Example: A price cut on electric vehicles may not be a true reduction if the quality (e.g., driving range) also decreases.
Demand Schedule and Demand Curve
Demand Schedule: A table showing quantities demanded at different prices for a specific time period and quality level.
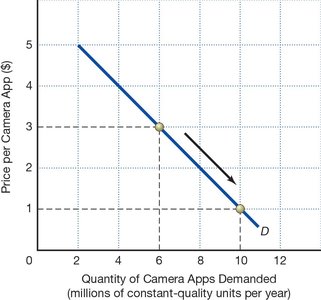
Demand Curve: A graphical representation of the demand schedule, typically downward sloping to reflect the law of demand.


Market Demand
Market Demand: The sum of all individual demands for a good or service at each price.
Obtained by horizontally summing individual demand curves.


Shifts in Demand
Determinants of Demand
Income:
Normal Goods: Demand increases as income rises.
Inferior Goods: Demand decreases as income rises.
Tastes and Preferences: Changes can shift demand left or right.
Prices of Related Goods:
Substitutes: An increase in the price of one increases demand for the other.
Complements: An increase in the price of one decreases demand for the other.
Expectations: About future prices, income, or product availability.
Market Size: Number of buyers in the market.
Example: If every college student receives a digital device, demand for camera apps increases at every price, shifting the demand curve rightward.

Changes in Demand vs. Changes in Quantity Demanded
Change in Demand: Caused by a change in a determinant other than the good’s own price; shifts the entire demand curve.
Change in Quantity Demanded: Caused by a change in the good’s own price; movement along the same demand curve.

Supply
Definition and Law of Supply
Supply: A schedule showing the relationship between price and quantity supplied for a specified period, other things being equal.
Law of Supply: There is a direct relationship between the price of a good and the quantity supplied, ceteris paribus. As price increases, quantity supplied increases, and vice versa.
Supply Schedule and Supply Curve
Supply Schedule: A table showing quantities supplied at different prices.
Supply Curve: A graphical representation of the supply schedule, typically upward sloping to reflect the law of supply.


Market Supply
Market Supply: The sum of all individual producers’ supplies at each price.
Obtained by horizontally summing individual supply curves.


Shifts in Supply
Determinants of Supply
Technology and Productivity: Improvements increase supply.
Prices of Inputs: Higher input prices decrease supply.
Price Expectations: Expectations of higher future prices may decrease current supply.
Taxes and Subsidies: Taxes decrease supply; subsidies increase supply.
Number of Firms: More firms increase market supply.
Example: A new programming method reduces costs, shifting the supply curve for camera apps rightward (increase in supply).

Changes in Supply vs. Changes in Quantity Supplied
Change in Supply: Caused by a change in a determinant other than the good’s own price; shifts the entire supply curve.
Change in Quantity Supplied: Caused by a change in the good’s own price; movement along the same supply curve.
Market Equilibrium
Equilibrium Price and Quantity
Equilibrium (Market Clearing) Price: The price at which quantity demanded equals quantity supplied; the intersection of the demand and supply curves.
Equilibrium Quantity: The quantity bought and sold at the equilibrium price.
At equilibrium, there is no tendency for price or quantity to change unless demand or supply shifts.

Surplus and Shortage
Surplus: Quantity supplied exceeds quantity demanded at a price above equilibrium; leads to downward pressure on price.
Shortage: Quantity demanded exceeds quantity supplied at a price below equilibrium; leads to upward pressure on price.
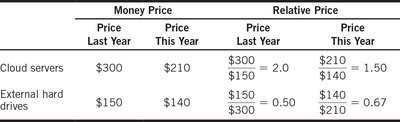
Summary Table: Money Price vs. Relative Price
Money Price | Relative Price | |||
|---|---|---|---|---|
Price Last Year | Price This Year | Price Last Year | Price This Year | |
Cloud servers | $300 | $210 | $300/$150 = 2.0 | $210/$140 = 1.50 |
External hard drives | $150 | $140 | $150/$300 = 0.50 | $140/$210 = 0.67 |
Key Equations
Relative Price Formula:
Summary of Learning Objectives
Law of Demand: Downward-sloping demand curve; higher prices lead to lower quantity demanded.
Changes in Demand vs. Quantity Demanded: Determinants other than price shift demand; price changes cause movement along the curve.
Law of Supply: Upward-sloping supply curve; higher prices lead to higher quantity supplied.
Changes in Supply vs. Quantity Supplied: Determinants other than price shift supply; price changes cause movement along the curve.
Market Equilibrium: Determined by the intersection of demand and supply; no surplus or shortage at equilibrium.
