 Back
BackDemand, Supply, and Price: Foundations of Market Equilibrium
Study Guide - Smart Notes
 Tailored notes based on your materials, expanded with key definitions, examples, and context.
3a Demand, Supply, and Price
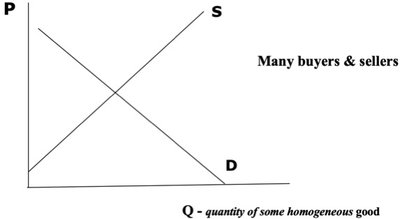
Competitive Markets and Price Determination
The competitive market model explains how prices are determined by the interaction of buyers and sellers. In such markets, the price and quantity of goods are established through the forces of demand and supply.
Quantity Demanded (QD): The amount of a good consumers are willing and able to purchase at a given price over a specific period. QD depends on the good's price, consumer income, tastes, prices of related goods, and the number of consumers.
Quantity Supplied (QS): The amount of a good producers are willing and able to sell at a given price over a specific period. QS depends on the good's price, input prices, technology, taxes/subsidies, prices of other products, expectations, and the number of firms.
Ceteris Paribus: Latin for "other things equal." Economists use this assumption to isolate the effect of one variable by holding others constant.
Law of Demand and Law of Supply
Law of Demand: There is an inverse relationship between price (P) and quantity demanded (QD), ceteris paribus. As price increases, QD decreases, and vice versa.
Law of Supply: There is a direct relationship between price (P) and quantity supplied (QS), ceteris paribus. As price increases, QS increases, and vice versa.
Movements vs. Shifts
Movement Along the Curve: Caused only by a change in the good's own price. This results in a change in quantity demanded or supplied.
Shift of the Curve: Caused by changes in other variables (e.g., income, tastes, input prices). This results in a change in demand or supply.
Important: Do not confuse a "change in demand" (shift) with a "change in quantity demanded" (movement).
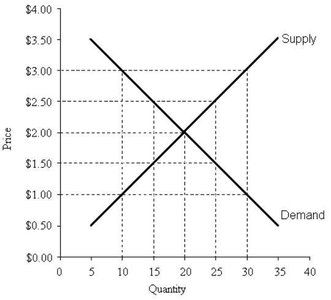
Example: Demand and Supply Schedules
P ($) | QD ('000/year) |
|---|---|
1.00 | 30 |
1.50 | 25 |
2.00 | 20 |
2.50 | 15 |
3.00 | 10 |
P ($) | QS ('000/year) |
|---|---|
1.00 | 10 |
1.50 | 15 |
2.00 | 20 |
2.50 | 25 |
3.00 | 30 |
3b Equilibrium Price & Quantity
Market Equilibrium
The equilibrium price and quantity are determined at the intersection of the demand and supply curves. At this point, the quantity demanded equals the quantity supplied, and there is no tendency for the price to change.
Equilibrium Price (P*): The price at which QD = QS.
Equilibrium Quantity (Q*): The quantity bought and sold at the equilibrium price.
Surplus: Occurs when QS > QD at a price above equilibrium, putting downward pressure on price.
Shortage: Occurs when QD > QS at a price below equilibrium, putting upward pressure on price.
Stability: At equilibrium, there is no surplus or shortage, so price remains stable.
3c Changes in Demand and Supply
Shifts in Demand and Supply
Changes in variables other than the good's own price cause the demand or supply curve to shift, resulting in a new equilibrium price and quantity.
Increase in Demand: Caused by higher income (for normal goods), lower income (for inferior goods), lower price of a complement, higher price of a substitute, or more consumers. The demand curve shifts right, increasing both equilibrium price and quantity.
Increase in Supply: Caused by lower input prices, improved technology, lower taxes or higher subsidies, lower price of a substitute in production, or more suppliers. The supply curve shifts right, decreasing equilibrium price and increasing equilibrium quantity.
Simultaneous Shifts: If both demand and supply increase, equilibrium quantity rises, but the effect on price depends on the relative size of the shifts.

3d Solving Demand and Supply Equations
Finding Equilibrium Algebraically
Equilibrium price and quantity can be found by solving the demand and supply equations simultaneously.
General Steps:
Set QD = QS.
Substitute the given equations for QD and QS.
Solve for the equilibrium price (P*).
Substitute P* back into either equation to find equilibrium quantity (Q*).
Example:
Given: and
Set
Solve for :
Find by substituting into either equation:

Additional info: The algebraic method is essential for analyzing more complex market scenarios, including policy interventions and comparative statics.
