 Back
BackDemand, Supply, and the Market Process: Core Principles and Applications
Study Guide - Smart Notes
 Tailored notes based on your materials, expanded with key definitions, examples, and context.
Demand, Supply, and the Market Process
Consumer Choice and the Law of Demand
The law of demand is a foundational concept in economics, describing the inverse relationship between the price of a good and the quantity demanded by consumers. As prices decrease, consumers are willing and able to purchase more of a good; as prices increase, the quantity demanded falls. This principle is observable in everyday markets, such as grocery stores, where prices coordinate the actions of millions of individuals globally.

Law of Demand: As the price of a good rises, the quantity demanded falls, ceteris paribus (all else equal).
Demand Curve: Graphically represents the relationship between price and quantity demanded. The curve typically slopes downward from left to right.
Market Demand Schedule: A table showing the quantity of a good consumers are willing to buy at various prices.
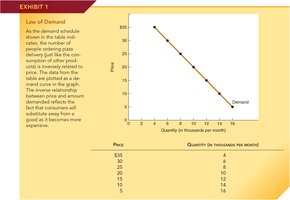
Example: If the price of pizza falls from $35 to $5, the quantity demanded increases from 2,000 to 16,000 units per month.
Consumer Surplus
Consumer surplus measures the net benefit to buyers from market exchange. It is the difference between what consumers are willing to pay for a good and what they actually pay. On a graph, consumer surplus is the area below the demand curve and above the market price.

Formula: For a linear demand curve, consumer surplus can be calculated as the area of a triangle:
Interpretation: The larger the consumer surplus, the greater the net benefit to consumers.
Elasticity of Demand
Elasticity measures the responsiveness of quantity demanded to changes in price. Demand is considered elastic if a small price change leads to a large change in quantity demanded, and inelastic if quantity demanded changes little with price.
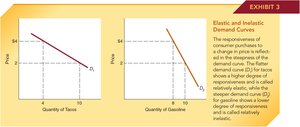
Elastic Demand: (e.g., tacos)
Inelastic Demand: (e.g., gasoline)
Formula:
Changes in Demand vs. Changes in Quantity Demanded
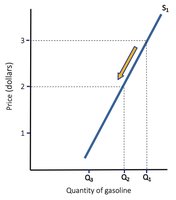
A change in quantity demanded is a movement along the demand curve due to a price change. A change in demand is a shift of the entire demand curve, caused by factors such as income, tastes, or the number of buyers.
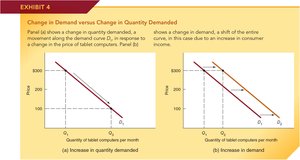
Increase in Quantity Demanded: Caused by a decrease in price (movement along the curve).
Increase in Demand: Caused by non-price factors (shift of the curve to the right).
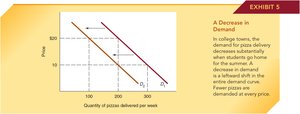
Decrease in Demand: Caused by non-price factors (shift of the curve to the left).
Producer Choice and the Law of Supply
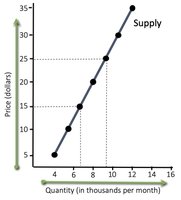
The law of supply states that as the price of a good increases, producers are willing to supply more of it. The supply curve typically slopes upward, reflecting higher opportunity costs for increased production.
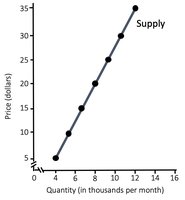
Supply Curve: Shows the minimum price necessary to induce producers to supply each quantity.
Market Supply Schedule: A table showing the quantity supplied at various prices.
Producer Surplus
Producer surplus is the difference between the lowest price a producer is willing to accept and the price actually received. It is represented by the area above the supply curve and below the market price.
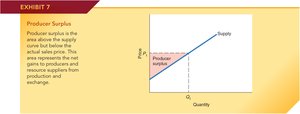
Formula: For a linear supply curve,
Interpretation: Producer surplus measures the net gains to producers from market exchange.
Elasticity of Supply
Elasticity of supply measures how responsive quantity supplied is to a change in price. Supply is elastic if quantity supplied changes significantly with price, and inelastic if it changes little.
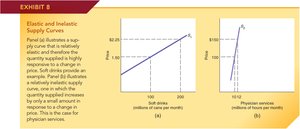
Elastic Supply: (e.g., soft drinks)
Inelastic Supply: (e.g., physician services)
Formula:
Changes in Supply vs. Changes in Quantity Supplied
A change in quantity supplied is a movement along the supply curve due to a price change. A change in supply is a shift of the entire supply curve, caused by factors such as input prices, technology, or the number of sellers.
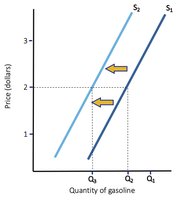
Increase in Supply: Supply curve shifts right.
Decrease in Supply: Supply curve shifts left.
Market Equilibrium
Market equilibrium occurs where the quantity demanded equals the quantity supplied. At this point, the market "clears" and there is no tendency for price to change unless an external factor shifts demand or supply.
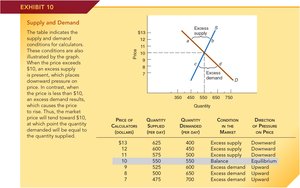


Excess Supply (Surplus): Occurs when price is above equilibrium; leads to downward pressure on price.
Excess Demand (Shortage): Occurs when price is below equilibrium; leads to upward pressure on price.
Equilibrium Price: The price at which quantity demanded equals quantity supplied.
Net Gains to Buyers and Sellers (Total Surplus)
Total surplus is the sum of consumer and producer surplus. At equilibrium, total surplus is maximized, meaning all mutually beneficial trades have occurred.
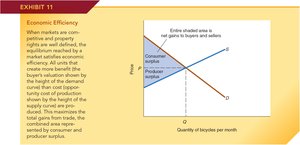
Economic Efficiency: Achieved when the sum of consumer and producer surplus is maximized.
Market Adjustments to Changes in Demand and Supply
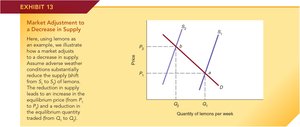
Markets respond to shifts in demand or supply by moving to a new equilibrium. An increase in demand raises both equilibrium price and quantity, while a decrease in supply raises price but lowers quantity.
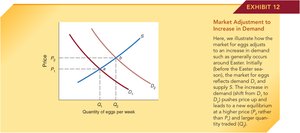
Increase in Demand: Shifts demand curve right; equilibrium price and quantity rise.
Decrease in Supply: Shifts supply curve left; equilibrium price rises, quantity falls.
Entrepreneurship, Profit, and Market Dynamics
Entrepreneurs play a critical role in market economies by seeking profit opportunities and driving innovation. Profits signal where resources are most valued, while losses indicate inefficiency. This dynamic process fosters competition and economic growth.
Profit: The reward for risk-taking and innovation in the market.
Market Competition: Encourages efficiency and the allocation of resources to their most valued uses.
The Invisible Hand Principle
The invisible hand, a concept introduced by Adam Smith, describes how individuals pursuing their own self-interest in competitive markets unintentionally promote the overall good of society. Market prices communicate information, coordinate actions, and motivate participants, leading to market order and efficiency.
Market Order: Emerges spontaneously from the voluntary interactions of buyers and sellers.
Efficiency Conditions: Competitive markets and well-defined property rights are essential for market efficiency.
