 Back
BackEconomic Efficiency, Government Price Setting, and Taxes: Core Concepts in Macroeconomics
Study Guide - Smart Notes
 Tailored notes based on your materials, expanded with key definitions, examples, and context.
Economic Efficiency, Government Price Setting, and Taxes
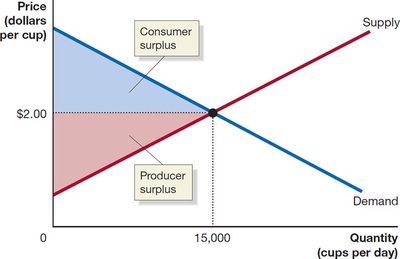
Consumer Surplus and Producer Surplus
Understanding how markets allocate resources efficiently requires the concepts of consumer surplus and producer surplus. These measures help economists evaluate the benefits that buyers and sellers receive from market transactions.
Consumer Surplus: The difference between the highest price a consumer is willing to pay for a good or service and the actual price paid. It represents the net benefit to consumers.
Producer Surplus: The difference between the lowest price a firm would accept for a good or service and the price it actually receives. It reflects the net benefit to producers.
Marginal Benefit: The additional benefit to a consumer from consuming one more unit of a good or service.
Marginal Cost: The change in a firm’s total cost from producing one more unit of a good or service.
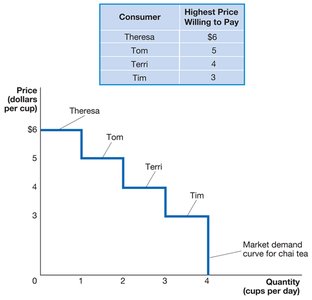
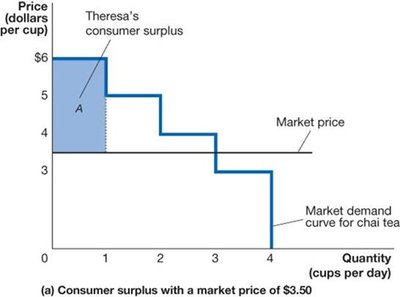
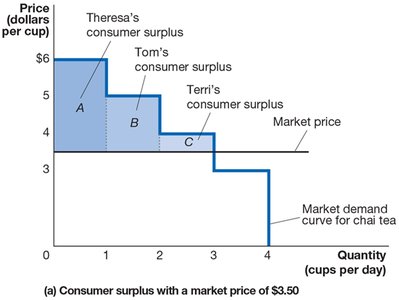
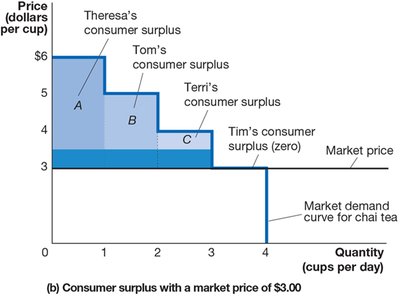
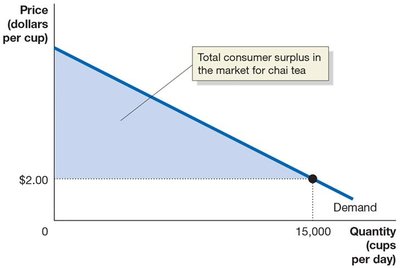
Example: If Theresa is willing to pay $6 for a cup of chai tea but pays only $3.50, her consumer surplus is $2.50. The total consumer surplus in a market is the area below the demand curve and above the market price.
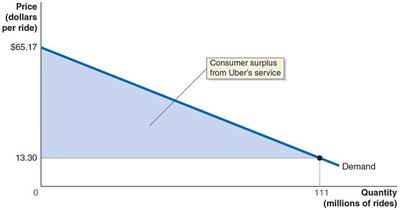
Example: Economists estimated the consumer surplus from Uber rides by calculating the area between the demand curve and the market price, finding a substantial benefit to consumers.
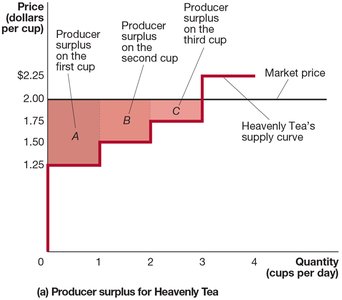
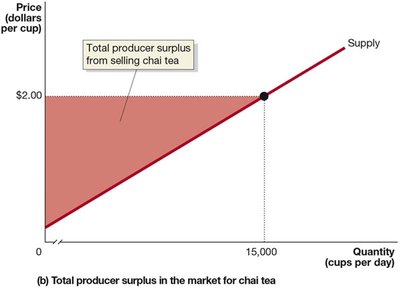
Example: If a tea producer receives $2.00 per cup but would have accepted $1.25, the producer surplus is $0.75 for that cup. The total producer surplus is the area above the supply curve and below the market price.
The Efficiency of Competitive Markets
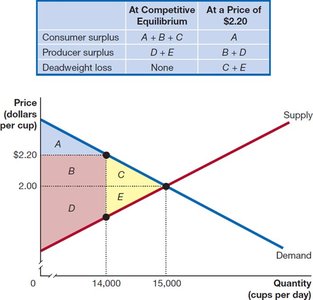
A market is considered efficient if it maximizes the sum of consumer and producer surplus, known as economic surplus. Efficiency occurs at the competitive equilibrium, where the marginal benefit to consumers equals the marginal cost to producers.
Economic Surplus: The sum of consumer surplus and producer surplus.
Deadweight Loss: The reduction in economic surplus resulting from a market not being in competitive equilibrium.
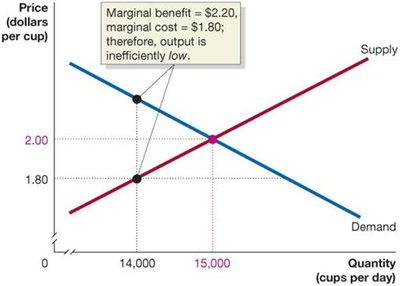
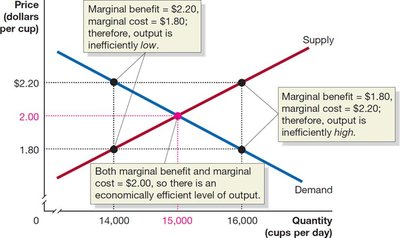

Example: If the price is set above or below equilibrium, either consumers or producers lose surplus, and deadweight loss arises, indicating inefficiency.
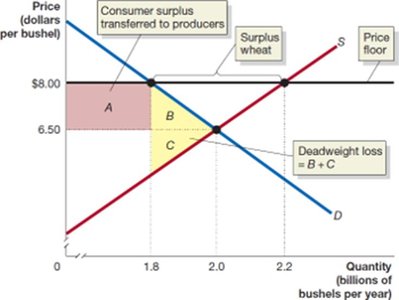
Government Intervention: Price Floors and Price Ceilings
Governments may intervene in markets by imposing price floors (minimum prices) or price ceilings (maximum prices). These interventions can lead to surpluses, shortages, and deadweight losses.
Price Ceiling: A legally determined maximum price that sellers may charge (e.g., rent control).
Price Floor: A legally determined minimum price that sellers may receive (e.g., minimum wage, agricultural price supports).
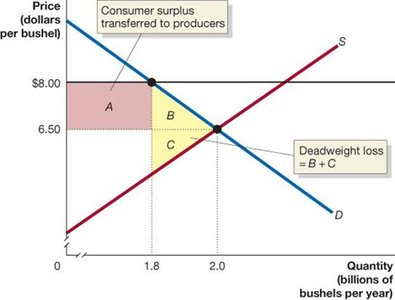
Example: A price floor above equilibrium (e.g., wheat at $8.00 instead of $6.50) reduces quantity traded, transfers surplus from consumers to producers, and creates deadweight loss.
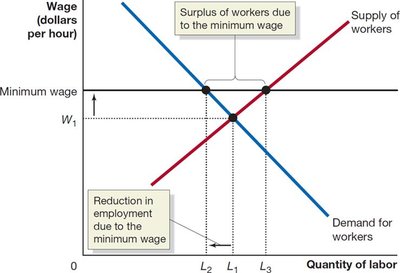
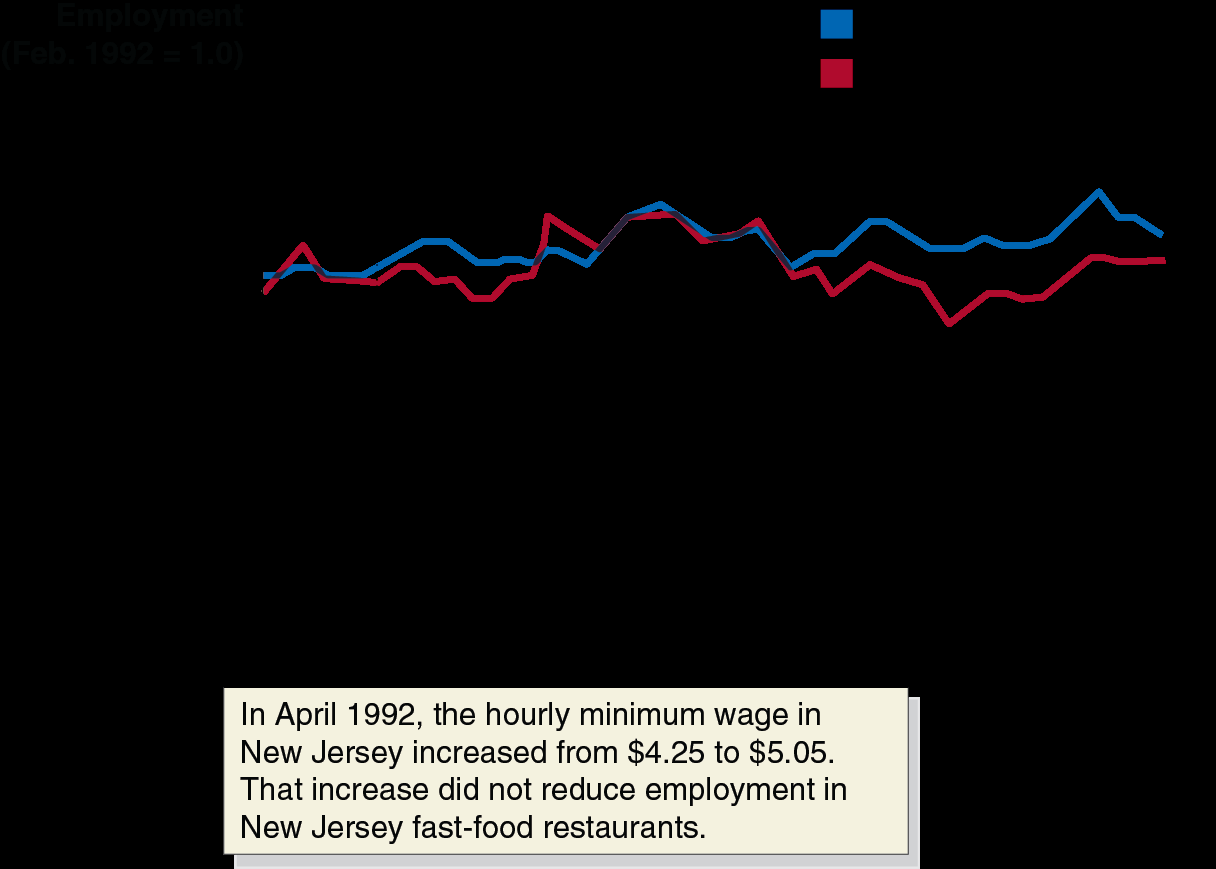
Example: Minimum wage laws may reduce employment and create deadweight loss, but empirical studies (e.g., Card and Krueger) sometimes find little or no negative effect on employment.
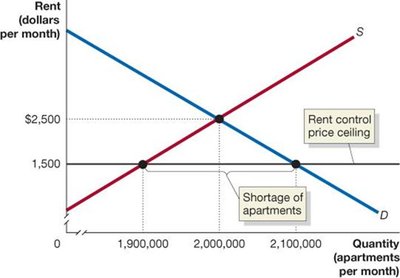
Example: Rent controls set below equilibrium create shortages, transfer surplus from landlords to renters, and generate deadweight loss.
The Economic Effect of Taxes
Taxes are a primary means for governments to raise revenue. A per-unit tax shifts the supply curve upward by the amount of the tax, increasing the price paid by consumers and reducing the price received by producers. Taxes create deadweight loss and reduce economic efficiency.
Tax Incidence: The actual division of the burden of a tax between buyers and sellers, determined by the relative elasticities of supply and demand, not by legal assignment.
Excess Burden: The deadweight loss from a tax.

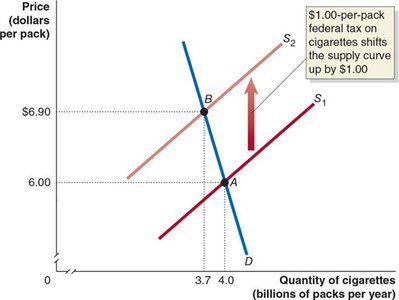
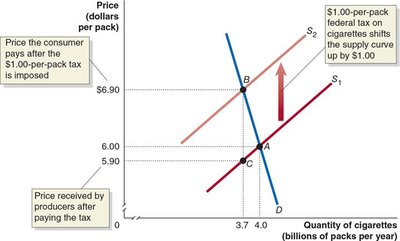
Example: A $1.00-per-pack tax on cigarettes raises the price for consumers, lowers the price received by producers, and generates tax revenue for the government, but also creates deadweight loss.
Quantitative Demand and Supply Analysis (Appendix)
Quantitative analysis allows for the calculation of equilibrium price and quantity, as well as the effects of government interventions such as rent controls.
Equilibrium Condition:
Example Equations: Demand: ; Supply:
Solving for Equilibrium: Set and solve for and .
Consumer Surplus (CS):
Producer Surplus (PS):
Competitive Equilibrium | Rent Control | |
|---|---|---|
Consumer Surplus | $2,531 million | $2,636 million |
Producer Surplus | $1,947 million | $347 million |
Deadweight Loss | $0 | $1,495 million |
Example: Imposing a rent ceiling reduces producer surplus and creates deadweight loss, even if consumer surplus increases slightly.
Summary Table: Effects of Rent Control
Competitive Equilibrium | Rent Control | |
|---|---|---|
Consumer Surplus | $2,531 million | $2,636 million |
Producer Surplus | $1,947 million | $347 million |
Deadweight Loss | $0 | $1,495 million |
Key Formulas
Consumer Surplus (CS):
Producer Surplus (PS):
Deadweight Loss (DWL):
Additional info: These notes expand on the original slides by providing definitions, formulas, and examples for each concept, ensuring a self-contained and comprehensive study guide for macroeconomics students.
