 Back
BackEconomic Fluctuations, Unemployment, and Inflation: Study Notes
Study Guide - Smart Notes
 Tailored notes based on your materials, expanded with key definitions, examples, and context.
Economic Fluctuations, Unemployment, and Inflation
Swings in the Economic Pendulum
Economic activity in market economies is characterized by fluctuations in output, employment, and prices. These fluctuations are commonly referred to as the business cycle, which consists of alternating periods of economic expansion and contraction. Understanding these cycles is crucial for analyzing macroeconomic performance and policy.
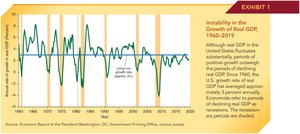
Instability in the Growth of Real GDP: 1960-2019
Real GDP measures the value of all final goods and services produced within a country, adjusted for inflation.
Although the U.S. economy has grown at an average rate of about 3% per year, this growth is not steady; it is marked by periods of rapid expansion and contraction (recessions).
Recessions are typically indicated by a decline in real GDP for two or more consecutive quarters.
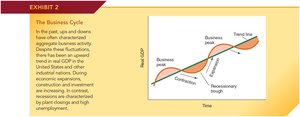
The Hypothetical Business Cycle
The business cycle consists of four main phases: expansion, peak, contraction, and recessionary trough.
During expansion, economic activity rises, leading to increased output and employment.
The peak marks the highest point before a downturn begins.
Contraction (or recession) is a period of declining economic activity.
The trough is the lowest point, after which recovery begins.
Economic Fluctuations and the Labor Market
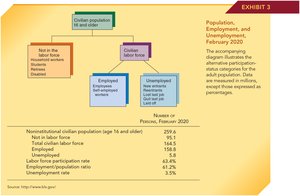
Labor Market Classifications and Indicators
The labor market is analyzed using several key classifications and indicators, which help economists assess the health of the economy and the effectiveness of policy interventions.
Civilian population includes all non-institutionalized individuals aged 16 and older.
The population is divided into those in the labor force (either employed or unemployed) and those not in the labor force (students, retirees, homemakers, etc.).
Employed individuals are those working for pay or profit.
Unemployed individuals are those not working but actively seeking employment.
Labor force participation rate is the percentage of the adult population that is in the labor force.
Unemployment rate is the percentage of the labor force that is unemployed.
Employment Fluctuations and Trends
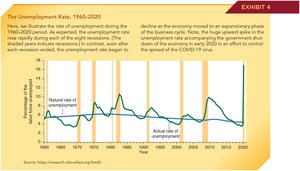
Unemployment rates fluctuate with the business cycle, rising during recessions and falling during expansions. The actual unemployment rate often exceeds the natural rate during and immediately after recessions.
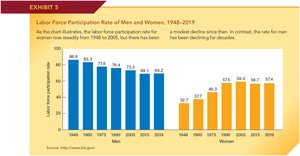
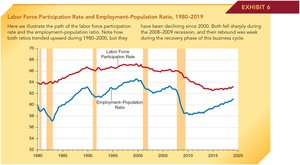
Labor Force Participation Rate Trends
The labor force participation rate for women has increased steadily since 1948, while the rate for men has declined.
Both the labor force participation rate and the employment-population ratio rose from 1980 to 2000, then declined, especially during and after the 2008-2009 recession.
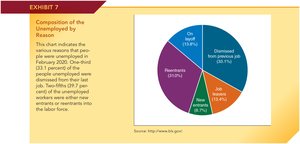
Composition of the Unemployed
Unemployment can be due to job loss, new entrants to the labor force, reentrants, or voluntary job leavers.
In February 2020, 33.1% of the unemployed were dismissed from their previous jobs, while 39.7% were new entrants or reentrants.
Unemployment Rate by Age and Gender
In February 2020, the unemployment rate was 3.6% for men and 3.4% for women.
Younger individuals (under 25) had higher unemployment rates than those over 25.
Types of Unemployment
Three Types of Unemployment
Frictional unemployment: Short-term unemployment that occurs when people are between jobs or entering the labor force for the first time.
Structural unemployment: Unemployment resulting from a mismatch between workers' skills and the requirements of available jobs, often due to technological change or shifts in the economy.
Cyclical unemployment: Unemployment caused by downturns in the business cycle; rises during recessions and falls during expansions.
Full Employment and the Natural Rate of Unemployment
The Concept of Full Employment
Full employment does not mean zero unemployment; rather, it refers to the absence of cyclical unemployment.
At full employment, only frictional and structural unemployment exist.
The Natural Rate of Unemployment
The natural rate of unemployment is the sum of frictional and structural unemployment.
This rate varies over time and across countries, depending on labor market policies and demographic factors.
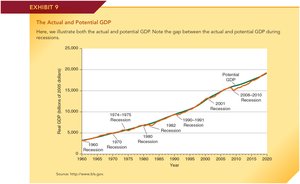
Actual and Potential GDP
Actual vs. Potential GDP
Potential GDP represents the maximum sustainable output of an economy when all resources are fully employed. Actual GDP fluctuates around potential GDP, with gaps during recessions (actual < potential) and booms (actual > potential).
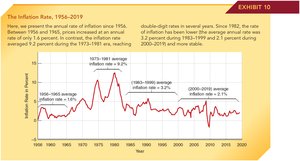
The Effects of Inflation
Inflation and Its Measurement
Inflation is the sustained increase in the general price level of goods and services in an economy over time.
The inflation rate is typically measured by the percentage change in the Consumer Price Index (CPI) or the GDP deflator.
Periods of high inflation can erode purchasing power and create uncertainty in the economy.
Unanticipated and Anticipated Inflation
Anticipated inflation is expected and can be planned for, while unanticipated inflation causes unexpected changes in real income and wealth.
Unanticipated inflation can redistribute income between borrowers and lenders and distort economic decision-making.
Effects and Causes of Inflation
Inflation can reduce the real value of money, savings, and fixed incomes.
It can also lead to menu costs, shoe-leather costs, and increased uncertainty.
Common causes of inflation include demand-pull factors (excess aggregate demand) and cost-push factors (rising production costs).
Key Formulas
Unemployment Rate:
Labor Force Participation Rate:
Inflation Rate (using CPI):
