 Back
BackEconomic Growth, the Financial System, and Business Cycles
Study Guide - Smart Notes
 Tailored notes based on your materials, expanded with key definitions, examples, and context.
Economic Growth, the Financial System, and Business Cycles
Key Concepts and Definitions
Business Cycle: The alternating periods of economic expansion and economic recession.
Economic Growth: An increase in real gross domestic product (GDP) or real GDP per capita.
Real GDP Per Capita: The amount of production in the economy, per person, adjusted for changes in the price level.
Standard of Living: The level of overall well-being enjoyed by an average individual, group, or society, often measured by real GDP per capita.
Long-Run Economic Growth
Growth in Real GDP Per Capita
Long-run economic growth refers to the sustained upward trend in real GDP per capita over time, which is the best measure of the standard of living. This growth is driven by increases in productivity, allowing the average person to consume more goods and services than in the past.
Example: In the United States, real GDP per capita grew from about $5,600 in 1900 to about $42,200 in 2010, meaning the average American could buy nearly eight times as many goods and services in 2010 as in 1900.
The Connection between Economic Prosperity and Health
Economic growth is closely linked to improvements in health and longevity. As countries grow wealthier, life expectancy rises due to better nutrition, healthcare, and living conditions.
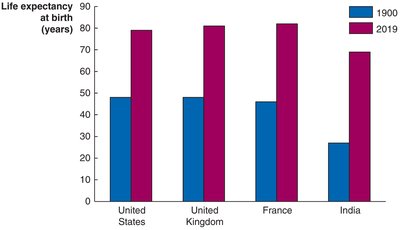
Example: Life expectancy at birth in high-income countries is expected to rise from about 80 years today to about 90 years by the mid-21st century.
Economic Growth and Leisure
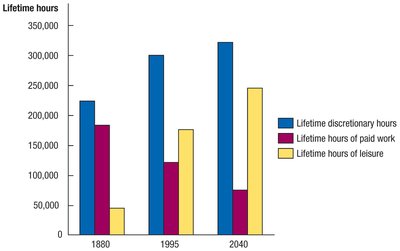
Technological advances and rising productivity have also increased the proportion of leisure time available to individuals, reducing the average number of hours worked per day and over a lifetime.
Calculating Growth Rates
The growth rate of an economic variable, such as real GDP or real GDP per capita, is the percentage change from one year to the next. Over several years, the average annual growth rate can be calculated.
Formula for Growth Rate:
Example: If real GDP was $18,051 billion in 2017 and $18,566 billion in 2018, the growth rate is:
Average Annual Growth Rate: For 2016 (1.6%), 2017 (2.2%), and 2018 (2.9%):
The Rule of 70
The Rule of 70 is a shortcut to estimate how long it will take for an economic variable to double, given its annual growth rate.
Example: At a growth rate of 5%, it takes years to double.
Labor Productivity
Labor productivity is the quantity of goods and services that can be produced by one worker or by one hour of work. Increases in real GDP per capita depend on increases in labor productivity.
Key Point: Most long-run economic growth is due to rising labor productivity.
Determinants of Long-Run Growth
Economic Freedom: Low taxes, few regulations, protection of property rights, and free trade encourage growth.
Competitive Markets: Secure property rights and independent courts support market efficiency.
Technological Innovation: New technologies and entrepreneurial activity increase productivity.
Investment in Physical and Human Capital: More capital and better-educated workers boost productivity.
Incentives to Save and Invest: Policies that encourage saving and investment support growth.
Low Inflation and Political Stability: Stable prices and governments foster a healthy economic environment.
Saving, Investment, and the Financial System
Overview of the Financial System
The financial system consists of financial markets (where securities like stocks and bonds are traded) and financial intermediaries (such as banks and insurance companies). It channels funds from savers to borrowers, facilitating investment and economic growth.
Key Services Provided:
Risk Sharing: Allows savers to diversify investments and reduce risk.
Liquidity: Makes it easy to convert financial assets into cash.
Information: Collects and communicates information about borrowers and expected returns.
The Market for Loanable Funds
The market for loanable funds is where borrowers and lenders interact, determining the market interest rate and the quantity of loanable funds exchanged. The demand for loanable funds comes from firms seeking to invest, while the supply comes from household savings and government surpluses.
Nominal Interest Rate: The stated interest rate on a loan.
Real Interest Rate: The nominal rate adjusted for inflation:
Shifts in the Loanable Funds Market
Changes in the demand or supply for loanable funds affect equilibrium interest rates and investment levels.
Increase in Demand: Technological change or optimism about future profits can increase the demand for loanable funds, raising both the equilibrium interest rate and the quantity of funds exchanged.
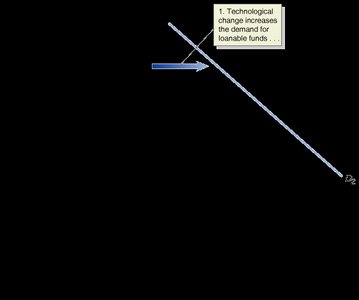
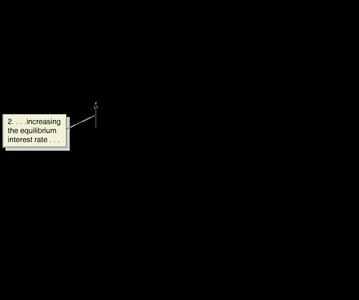
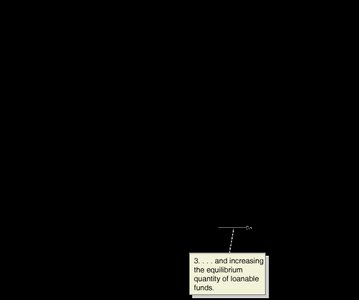
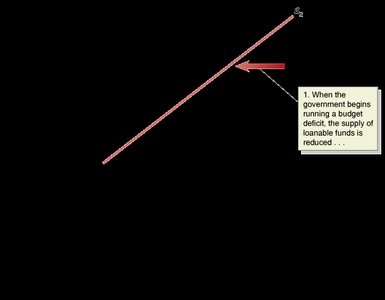
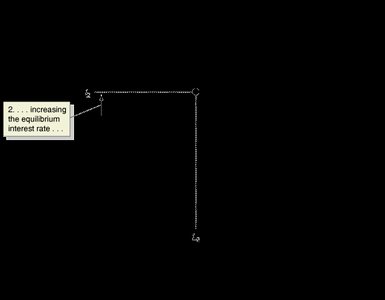
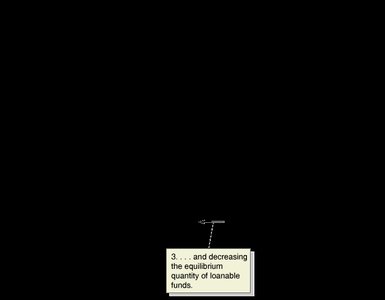
Decrease in Supply (e.g., Budget Deficit): When the government runs a budget deficit, the supply of loanable funds decreases, raising the equilibrium interest rate and reducing the quantity of funds exchanged. This is known as "crowding out."
The Business Cycle
Phases of the Business Cycle
The business cycle consists of alternating periods of economic expansion (rising real GDP) and recession (falling real GDP). Expansions and recessions are identified by changes in real GDP and other economic indicators.
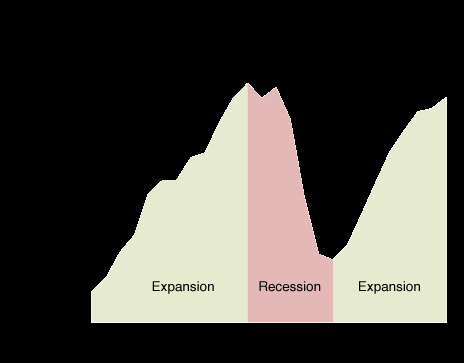
Peak: The highest point before a recession begins.
Trough: The lowest point before an expansion begins.
Historical Patterns of U.S. Business Cycles
Peak | Trough | Length of Recession |
|---|---|---|
July 1953 | May 1954 | 10 months |
August 1957 | April 1958 | 8 months |
April 1960 | February 1961 | 10 months |
December 1969 | November 1970 | 11 months |
November 1973 | March 1975 | 16 months |
January 1980 | July 1980 | 6 months |
July 1981 | November 1982 | 16 months |
July 1990 | March 1991 | 8 months |
March 2001 | November 2001 | 8 months |
December 2007 | June 2009 | 18 months |
Why Is the Economy More Stable?
Growth of the service sector, which is less volatile than goods production.
Unemployment insurance and government transfer programs provide a safety net.
Active government policies to stabilize the economy.
Effects of Recessions on Unemployment and Inflation
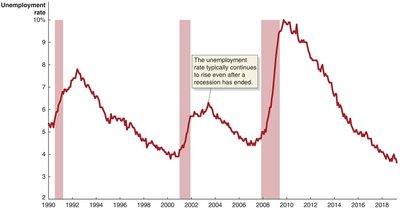
During recessions, firms reduce production and lay off workers, causing unemployment to rise. Unemployment often continues to rise even after a recession ends.
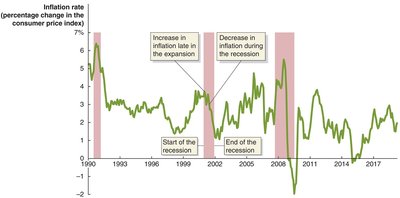
Inflation tends to rise toward the end of an expansion and fall during recessions, though this is not always the case.
Test Your Understanding of Macroeconomic Indicators
Unemployment Rate and Labor Force Participation: Both can rise if more people enter the workforce but do not immediately find jobs.
GDP and Wealth: GDP measures production, not total wealth.
GDP and Living Standards: A decrease in GDP does not always reduce individual living standards.
Nominal vs. Real GDP: If nominal GDP rises by less than the inflation rate, real GDP falls.
Types of Unemployment: Frictional (voluntary, between jobs) and structural (mismatch of skills) are different.
Inflation and Borrowers/Lenders: Unanticipated inflation helps borrowers (they repay with less valuable money) and hurts lenders.
Inflation and Unemployment: The relationship is not guaranteed; both can move together or in opposite directions depending on the business cycle.
Full Employment: Does not mean zero unemployment; typically around 5% unemployment is considered "full employment."
