 Back
BackEconomic Theories, Data, and Graphs: Foundations for Macroeconomic Analysis
Study Guide - Smart Notes
 Tailored notes based on your materials, expanded with key definitions, examples, and context.
Chapter 2: Economic Theories, Data, and Graphs
2.1 Positive and Normative Statements
Understanding the distinction between positive and normative statements is fundamental in economics. This distinction clarifies the difference between objective analysis and value-based judgments.
Positive Statements: Statements about what is, was, or will be. They are factual and can be tested or validated by evidence.
Normative Statements: Statements about what ought to be. They involve value judgments and cannot be tested solely by facts.
Example Table:
Positive Statement | Normative Statement |
|---|---|
Raising interest rates encourages people to save. | People should be encouraged to save. |
High rates of income tax encourage people to evade paying taxes. | Governments should design taxes so that people cannot avoid paying them. |
Increasing the price of cigarettes leads people to smoke less. | The government should raise the tax on cigarettes to discourage people from smoking. |
Disagreements Among Economists: Many public disagreements stem from mixing positive and normative statements. Responsible economists clarify which parts of their advice are factual and which are based on values.
2.2 Building and Testing Economic Theories
Economic theories are simplified representations of reality, designed to explain and predict economic phenomena. Theories are tested against real-world data and are revised or replaced if inconsistent with evidence.
Theory: An abstraction from reality, consisting of variables, assumptions, and predictions (hypotheses).
Testing Theories: Theories are tested by comparing predictions with data. If predictions fail, theories are amended or discarded.
Economic Models: Models formalize theories and can be visual, graphical, verbal, or mathematical. They focus on essential features and ignore unimportant details for clarity and usefulness.
Characteristics of a Good Model:
Clarity
Predictive accuracy
Improved communication
Practical usefulness
Example: Alan Greenspan's reflection after the 2007-09 financial crisis illustrates how economists revise theories when confronted with new evidence.
Statistical Analysis in Economics
Statistical analysis is essential for testing economic hypotheses, especially since real-world data is influenced by many simultaneous factors.
Correlation vs. Causation: Correlation means two variables move together, but does not imply one causes the other. Establishing causality requires advanced statistical methods.
Endogeneity: Refers to situations where explanatory variables are correlated with the error term, complicating causal inference.
Institutions and Economic Growth
Institutions such as rule of law, property rights, and free markets have significant effects on long-run economic growth. Empirical studies show that countries with strong institutions tend to have higher income per capita.
Example: The contrast between North and South Korea demonstrates the impact of institutions on economic outcomes.
2.3 Economic Data
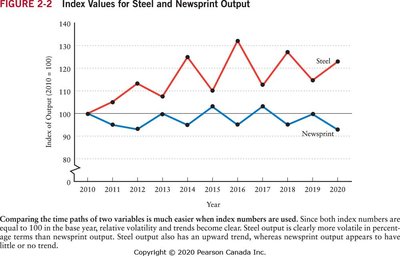
Economic data is used to measure and analyze economic activity. Index numbers are commonly used to compare variables over time or across regions.
Index Number: A measure expressed relative to a base period (base = 100).
Formula for Index Number:

Example: Consumer Price Index (CPI) is a complex index number used to measure inflation.
Graphing Economic Data
Economic data can be represented in various forms:
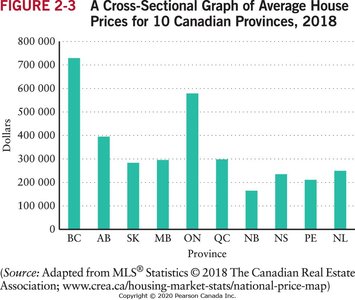
Cross-sectional Data: Observations at a single point in time across different units (e.g., provinces, countries).
Time-series Data: Observations of a variable over time.
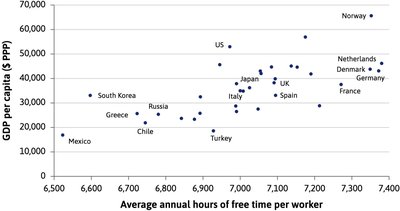
Scatter Diagram: Graphs two variables to examine their relationship.
2.4 Graphing Economic Theories
Economic relationships are often expressed as functions, which can be represented verbally, numerically, mathematically, or graphically.
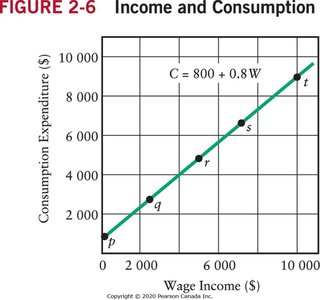
Example Function: Consumption as a function of wage income:
Interpretation: When wage income is zero, consumption is $800. For every additional dollar of wage income, consumption increases by $0.80.
Linear and Non-Linear Relationships
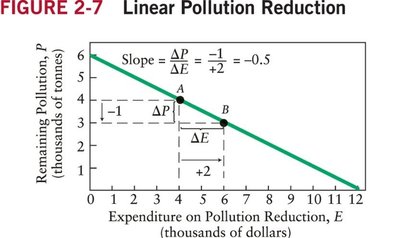
Linear Relationship: Two variables are linearly related if their graph is a straight line. The slope is constant and calculated as .
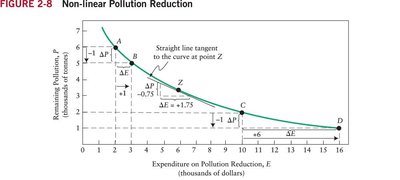
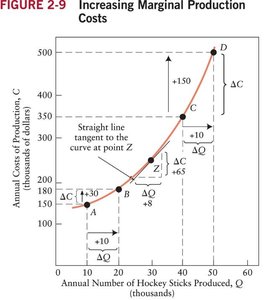
Non-Linear Relationship: The slope changes as X changes. Examples include diminishing marginal response and increasing marginal cost.
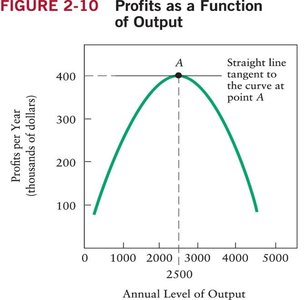
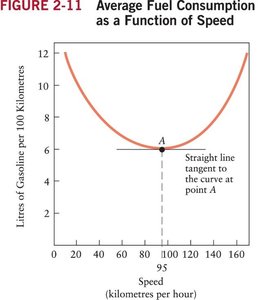
Functions with a Minimum or Maximum
Some economic functions have a minimum or maximum point, which can be identified graphically as the lowest or highest point on a curve.
A Final Word of Warning When Using Data
Data can be misused or misrepresented, intentionally or unintentionally. It is crucial to critically evaluate data sources, definitions, and presentation methods.
Always contextualize numbers (e.g., per capita, raw values).
Understand variable definitions and graphing methods.
Be cautious with survey data due to potential selection bias.
Be skeptical of percentages in headlines; small absolute changes can appear large in percentage terms.
Formula for Percentage Growth Rate:
Example: If violent crime rises from 1 to 2 cases, the percentage increase is 100%, but the absolute change is small.
