 Back
BackFiscal Policy and Its Macroeconomic Effects
Study Guide - Smart Notes
 Tailored notes based on your materials, expanded with key definitions, examples, and context.
Fiscal Policy
What Is Fiscal Policy?
Fiscal policy refers to the use of government spending, transfer payments, and taxation to influence macroeconomic outcomes such as real GDP, unemployment, and inflation. It is a primary tool for managing economic fluctuations and achieving policy objectives.
Discretionary Fiscal Policy: Deliberate changes in government purchases or taxes to influence aggregate demand.
Automatic Stabilizers: Government expenditures and taxes that automatically increase or decrease with the business cycle (e.g., unemployment insurance payments rise during recessions).
Federal Government Expenditures: Include defense, salaries, transfer payments (Social Security, Medicare), grants to state/local governments, and interest on debt.
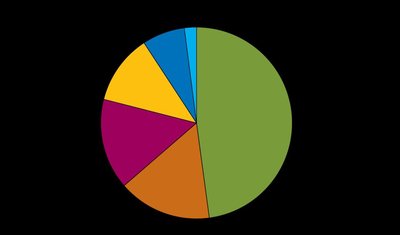
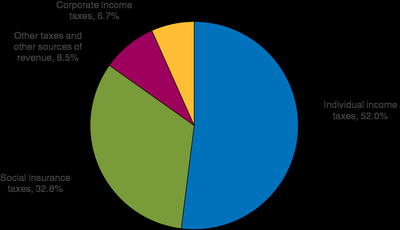
Federal Government Revenue: Primarily from individual income taxes and payroll taxes (Social Security, Medicare), with smaller shares from corporate income taxes, excise taxes, tariffs, and other sources.
The Effects of Fiscal Policy on Real GDP and the Price Level
How Fiscal Policy Affects Aggregate Demand
Fiscal policy influences aggregate demand (AD) through changes in government purchases and taxes:
Government Purchases: Directly increase AD.
Taxes: Affect disposable income, which influences consumption and thus AD indirectly.
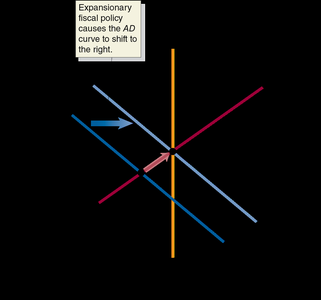
Expansionary Fiscal Policy
Increases government purchases or decreases taxes to boost AD.
Used when real GDP is below potential GDP to reduce unemployment.
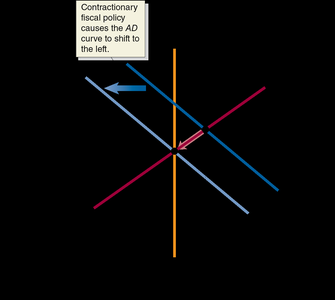
Contractionary Fiscal Policy
Decreases government purchases or increases taxes to reduce AD.
Used when real GDP is above potential GDP to reduce inflation.
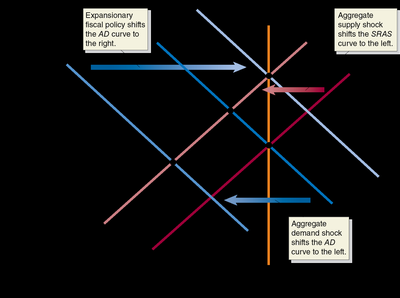
Case Study: The Covid-19 Pandemic
Economic shutdowns caused both aggregate supply (SRAS) and aggregate demand (AD) to shift left.
Large expansionary fiscal policy shifted AD right, helping restore GDP but contributing to inflation.
Countercyclical Fiscal Policy
Problem | Type of Policy Required | Actions by Congress and the President | Result |
|---|---|---|---|
Recession | Expansionary | Increase government purchases or cut taxes | Real GDP and the price level rise |
Rising inflation | Contractionary | Decrease government purchases or raise taxes | Real GDP and the price level fall |
Additional info: The effects assume other factors, including monetary policy, remain constant. Contractionary policy typically lowers inflation rather than causing outright deflation.
Fiscal Policy in the Dynamic Aggregate Demand and Aggregate Supply Model
Dynamic AD-AS Model and Fiscal Policy
The dynamic AD-AS model incorporates changes in potential GDP and the price level over time, providing a more realistic framework for analyzing fiscal policy.
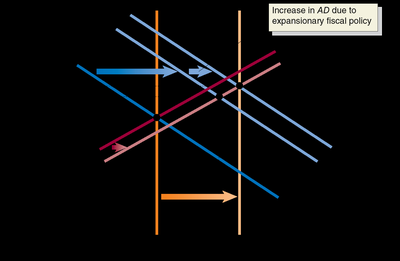
Expansionary Policy: Used when projected AD growth is insufficient for full employment; increases AD and the price level.
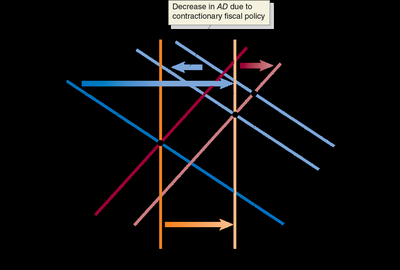
Contractionary Policy: Used when projected AD growth is excessive, risking high inflation; decreases AD and stabilizes the price level.
The Government Purchases, Tax, and Transfer Payment Multipliers
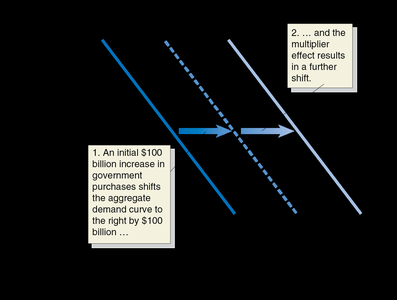
The Multiplier Effect
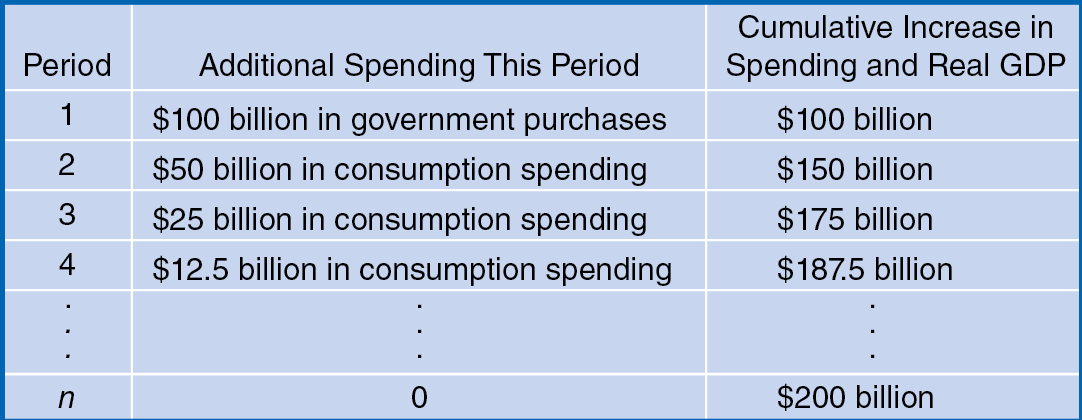
The multiplier effect describes how an initial change in autonomous expenditure (such as government purchases) leads to a larger change in real GDP due to induced increases in consumption.
Autonomous Increase: Direct effect of government spending.
Induced Increase: Additional consumption resulting from higher incomes.
Period | Additional Spending This Period | Cumulative Increase in Spending and Real GDP |
|---|---|---|
1 | $100 billion in government purchases | $100 billion |
2 | $50 billion in consumption spending | $150 billion |
3 | $25 billion in consumption spending | $175 billion |
4 | $12.5 billion in consumption spending | $187.5 billion |
... | ... | ... |
n | 0 | $200 billion |
Formulas for Multipliers
Government Purchases Multiplier:
Tax Multiplier:
Transfer Payments Multiplier:
Example: If MPC = 0.75, the government purchases multiplier is 4, and the tax multiplier is -3.
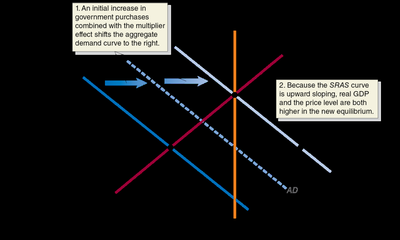
Multiplier Effect and Aggregate Supply
When aggregate demand increases, both real GDP and the price level rise due to the upward-sloping short-run aggregate supply (SRAS) curve.
Balanced Budget Multiplier
If government purchases and taxes are increased by the same amount, the net effect on GDP is equal to the change in government purchases:
This is because the government purchases multiplier is always one greater (in absolute value) than the tax multiplier.
Incorporating Tax Rates
When taxes depend on income (tax rate t), the government purchases multiplier becomes:
Lower tax rates increase the size of the multiplier.
The Multiplier in an Open Economy
When imports depend on income, the multiplier is further reduced. The formula becomes:
Where MPI is the marginal propensity to import. A higher MPI means a smaller multiplier, as more spending leaks abroad.
Summary Table: Countercyclical Fiscal Policy
Problem | Type of Policy Required | Actions by Congress and the President | Result |
|---|---|---|---|
Recession | Expansionary | Increase government purchases or cut taxes | Real GDP and the price level rise |
Rising inflation | Contractionary | Decrease government purchases or raise taxes | Real GDP and the price level fall |
