 Back
BackLecture 10: Fiscal Policy
Study Guide - Smart Notes
 Tailored notes based on your materials, expanded with key definitions, examples, and context.
Government Budgets and Fiscal Policy
Introduction to Fiscal Policy
Fiscal policy refers to the use of government spending and taxation to influence the macroeconomy. It is a central tool for managing economic growth, unemployment, and inflation, and is primarily controlled by the legislative and executive branches of government.
Government spending + Taxation -> Influence macroeconomy, used to manage economic growth, U, Inflation, controlled by Congress & President.
Budget Deficit: Occurs when government outlays exceed revenue in a given year. 1yr = outlays > revenue
Budget Surplus: Occurs when government revenue exceeds outlays. Revenue > Outlays
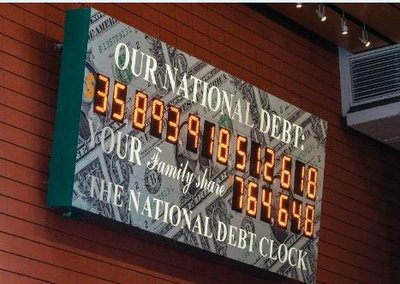
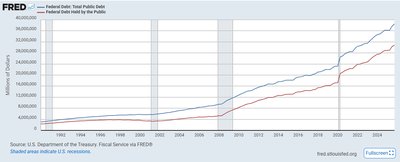
National Debt: The accumulation of all past deficits and surpluses. sum of all deficits & Surpluses
Government Outlays and Revenues
| ||||
|---|---|---|---|---|
Mandatory = Required by law. Discretionary = changeable spending during budget process. Interest Payments = payments on national debt. |
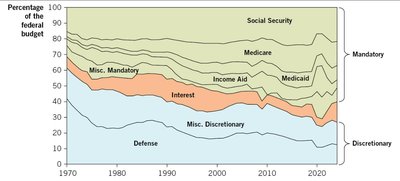
TYPES of Government Outlays (Spending)
Government outlays are the spending side of the budget and include both direct spending and transfer payments. Outlays are divided into three main categories:
Mandatory Outlays: Spending required by law, such as Social Security and Medicare.
Discretionary Outlays: Spending that can be altered during the annual budget process, such as defense and education.
Interest Payments: Payments on the national debt.
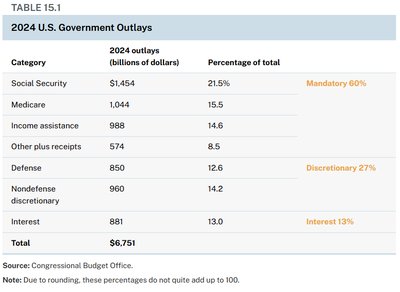 (Mandatory Outlays are often the majority of the Budget Process).
Transfer Payments: Payments made to individuals or groups without receiving a good or service in return (e.g., Social Security, welfare).
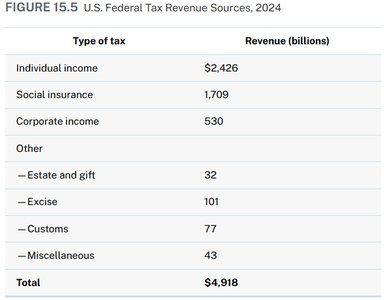
Sources of Government Revenue(INCOME)
Most government revenue is raised through taxes. The two largest sources for the U.S. federal government are:
Individual Income Tax = Government's PRIMARY source of income
Social Insurance Tax (for Social Security and Medicare)
 (INDIVIDUAL INCOME TAX = Gov't largest revenue source. )
In 2024, these two sources accounted for 84% of all federal tax revenue.
Deficits, Debt, and Their Macroeconomic Significance
Deficits Vs. Debt
Understanding the difference between deficits and debt is crucial for macroeconomic analysis:
Deficit: The shortfall in revenue for a particular year’s budget. fall in revenue for year _.
Debt: The total of all accumulated and unpaid budget deficits. sum of accumulated & Unpaid deficits
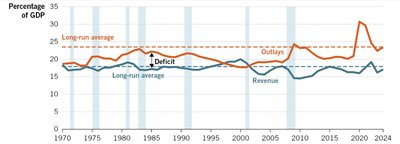
Economists often express deficits as a percentage of GDP to account for changes in the size of the economy and population.
Types of Fiscal Policy
Expansionary and Contractionary Fiscal Policy
Fiscal policy can be used to either stimulate or slow down the economy:
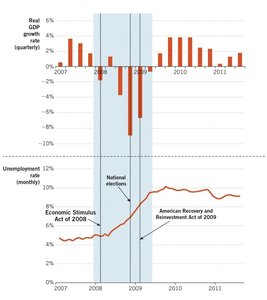
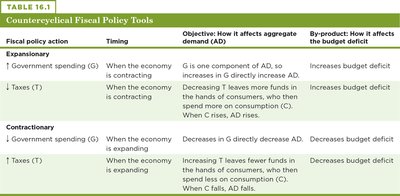
Expansionary Fiscal Policy: Increases government spending and/or decreases taxes to stimulate economic activity, typically during recessions.
Contractionary Fiscal Policy: Decreases government spending and/or increases taxes to slow economic activity, typically during expansions to control inflation or pay down debt.
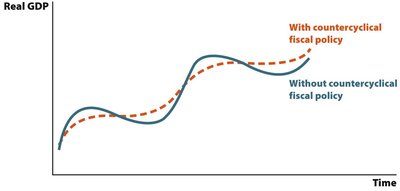
Countercyclical Fiscal Policy
Countercyclical fiscal policy aims to smooth out fluctuations in the business cycle by applying expansionary policy during recessions and contractionary policy during expansions.
The Multiplier Effect:
The multiplier effect describes how an initial change in spending leads to a larger change in overall economic activity. This is because "one person's spending becomes another person's income", which then gets spent again, and so on.
Marginal Propensity to Consume (MPC): The fraction of additional income that is spent on consumption. disposable income; fraction between 0 and 1; higher MPC more someone is spending -> larger consumption , larger effect on AD.
Spending Multiplier (ms): The total effect on spending from an initial change in government expenditures.
Formula for the spending multiplier: (REMINDER: I get formula sheet provided on exams).
Example: If MPC = 0.75, then


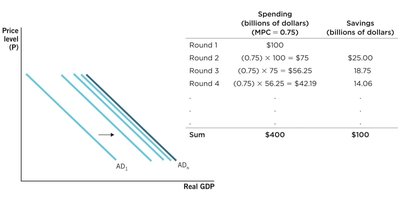 IMPORTANT MODEL !!!!!!
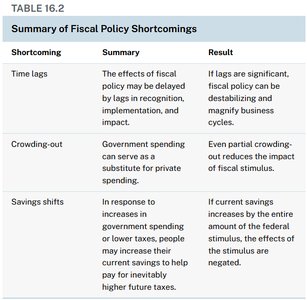
Shortcomings of Fiscal Policy
Time Lags [3 Types]
There are three main types of time lags that can reduce the effectiveness of fiscal policy:
Recognition Lag: Delay in identifying economic trends.
Implementation Lag: Delay in enacting policy changes.
Impact Lag: Delay before policy effects are fully realized.
Posibility that economy (which has factors that bring economy back to normal - by the time these lags are recognized economy can be pushed to far by gov efforts bringing inflation.
 ti
ti
Automatic Stabilizers
Automatic stabilizers are government programs that automatically implement countercyclical fiscal policy in response to economic conditions, reducing the need for active intervention and minimizing lags. Examples include progressive income taxes and unemployment compensation. Gov't Program activates COUNTERCYCLE FISCAL POLICY = Reduced need for active intervention & Minimizes lags.
Crowding Out
Crowding out occurs when increased government spending leads to a reduction in private sector spending, particularly investment and consumption, due to higher interest rates from government borrowing.
Gov't goes from balanced budget -> budget deficit

Savings Shifts
The new classical critique suggests that increases in government spending or decreases in taxes may be offset by increased private savings if people expect higher future taxes, reducing the effectiveness of fiscal policy.
Supply-Side Fiscal Policy
Definition and Tools
Supply-side fiscal policy aims to increase the productive capacity of the economy by influencing aggregate supply (AS) rather than aggregate demand (AD). This is achieved through policies that improve incentives for production, investment, and innovation.
Research and development (R&D) tax credits
Subsidies or tax breaks for education NOTICE: Each of these have the key word: TAX. + they're all POSITIVE INCENTIVES
Lower corporate profit tax rates
Lower marginal income tax rates
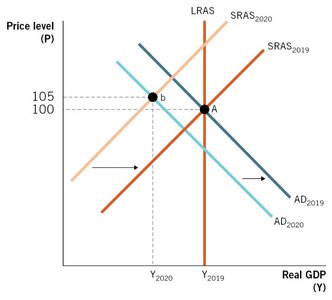 POINT (A):
POINT (B):
Marginal Income Tax Rates and the Laffer Curve
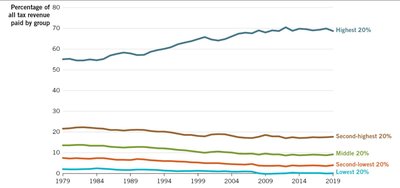
Progressive Taxation and Marginal Rates
The U.S. uses a progressive income tax system = higher incomes are taxed at higher rates. The marginal tax rate = rate paid on the next dollar of income.
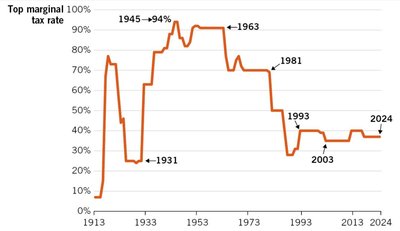 Explanation of marginal tax rate:
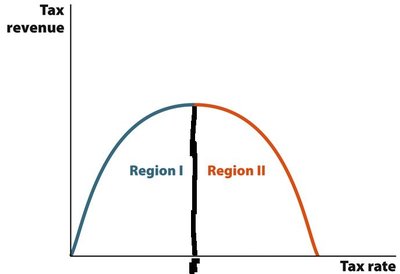
The Laffer Curve
The Laffer Curve illustrates the relationship between tax rates and tax revenue. At low tax rates, increasing rates increases revenue, but at high rates, further increases can reduce revenue by discouraging production and income generation.
If tax rates are in Region I, then cutting tax rates decreases tax revenue.
If tax rates are in Region II, then cutting tax rates increases tax revenue.
Conclusion
Fiscal policy is a powerful tool for managing the macroeconomy, but it is subject to important limitations such as time lags, crowding out, and savings shifts. Both demand-side and supply-side policies play roles in shaping economic outcomes, and understanding their mechanisms is essential for effective policy design and evaluation.
