 Back
BackFoundations of Economics: Key Concepts and Applications
Study Guide - Smart Notes
 Tailored notes based on your materials, expanded with key definitions, examples, and context.
Introduction to Economics
What is Economics?
Economics is the study of the choices people and societies make to attain their unlimited wants, given their scarce resources. It is divided into two main branches: microeconomics and macroeconomics.
Microeconomics: Focuses on the behavior of individual households and firms, their interactions in markets, and the role of government in influencing these choices.
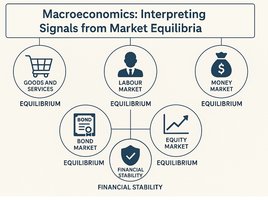
Macroeconomics: Examines the economy as a whole, including aggregate measures such as inflation, unemployment, and economic growth.
Economics: Foundations and Models
Scarcity, Resources, and Trade-offs
Scarcity is a fundamental concept in economics, arising because resources are limited while wants are unlimited. This leads to the necessity of making choices and facing trade-offs.
Scarcity: The situation in which unlimited wants exceed the limited resources available to fulfill those wants.
Resources: Inputs used to produce goods and services, including natural resources (land, water, minerals), labor, capital, and entrepreneurial ability.
Trade-off: Choosing more of one good or service means producing less of another due to scarcity.
Economic Models: Analytical Framework
Economists use models to simplify and analyze real-world economic situations. The process of developing an economic model typically involves:
Deciding on the assumptions to be used in developing the model.
Formulating a testable hypothesis.
Using economic data to test the hypothesis.
Revising the model if it fails to explain the economic data.
Retaining the revised model to help answer similar economic questions in the future.
Economic models often use graphs and formulas to represent relationships and simplify complex realities, much like a map simplifies geographic information.
Positive vs. Normative Analysis
Positive Analysis: Concerned with 'what is'; involves objective, value-free statements that can be tested with facts.
Normative Analysis: Concerned with 'what ought to be'; involves subjective value judgments that cannot be tested.
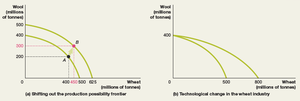
Production Possibility Frontier (PPF)
Understanding the PPF
The Production Possibility Frontier (PPF) is a curve that shows the maximum attainable combinations of two products that may be produced with available resources and current technology. It illustrates the concepts of scarcity, trade-offs, and opportunity cost.
Points on the PPF represent efficient production levels.
Points inside the PPF are inefficient (not all resources are used).
Points outside the PPF are unattainable with current resources.
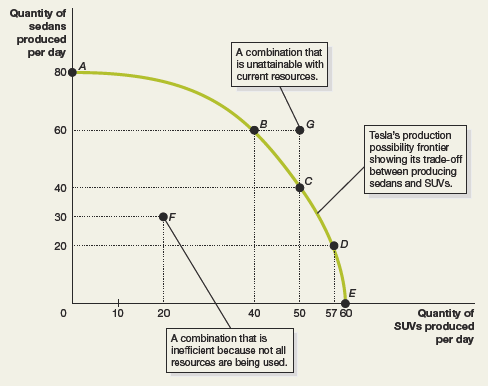
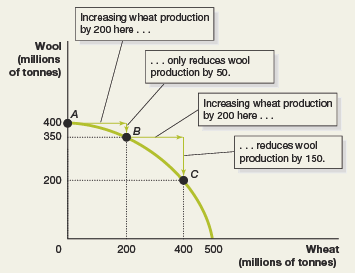
Increasing Marginal Opportunity Cost
As more of one good is produced, the opportunity cost of producing additional units increases. This is reflected in the bowed-out shape of the PPF.
Opportunity cost is the value of the next best alternative foregone.
Increasing marginal opportunity cost occurs because resources are not equally efficient in producing all goods.
Economic Growth and the PPF
Economic growth is represented by an outward shift of the PPF, indicating an increase in an economy's production potential. Growth can result from factors such as technological advancements or increases in resources.
Growth allows for higher production of both goods.
Technological change in one sector shifts the PPF outward more for that good.
Specialisation, Trade, and Comparative Advantage
Specialisation and Gains from Trade
Specialisation occurs when individuals or countries focus on producing goods for which they have a comparative advantage, leading to greater overall efficiency and gains from trade.
Trade: The act of buying or selling a good or service in a market.
Absolute Advantage: The ability to produce more of a good or service than competitors using the same amount of resources.
Comparative Advantage: The ability to produce a good or service at a lower opportunity cost than others.
Example: If you can produce 1 apple at the cost of 1 cherry, and your neighbor produces 1 apple at the cost of 2 cherries, you have a comparative advantage in apples.
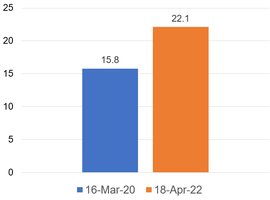
Macroeconomic Applications: Inflation, Money, and Interest Rates
Inflationary Signals and Policy Responses
Macroeconomics examines how aggregate indicators such as inflation are influenced by government and central bank policies. For example, expansionary fiscal and monetary policies during the COVID-19 pandemic led to increased money supply and inflationary pressures.
Expansionary Policy: Actions by government and central banks to stimulate the economy, often by increasing spending or lowering interest rates.
Inflation: A general increase in prices and fall in the purchasing value of money.
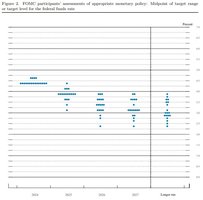
The Federal Reserve's Dot Plot
The Federal Reserve (Fed) uses the dot plot as a tool to communicate its expectations for future interest rates. Each dot represents a policymaker's projection for the federal funds rate at year-end.
The vertical axis shows interest rates (%), and the horizontal axis shows time.
Clusters of dots indicate consensus; dispersion signals uncertainty.
Markets often focus on the median dot, but the full distribution provides important context.
The Yield Curve
The yield curve illustrates the relationship between interest rates (yields) and the maturities of government bonds at a point in time. It is a key indicator of market expectations for economic growth and potential recessions.
Normal Yield Curve: Upward sloping; long-term bonds have higher yields than short-term bonds, indicating expectations of economic growth.
Inverted Yield Curve: Downward sloping; short-term yields exceed long-term yields, often signaling expectations of slowing growth or recession.
Summary Table: Key Economic Concepts
Concept | Definition | Example/Application |
|---|---|---|
Scarcity | Unlimited wants exceed limited resources | Choosing between producing cars or computers |
Opportunity Cost | Value of next best alternative foregone | Producing more sedans means fewer SUVs |
Comparative Advantage | Lower opportunity cost in production | Country A produces wheat, Country B produces wool |
PPF | Maximum output combinations with given resources | Trade-off between sedans and SUVs |
Yield Curve | Relationship between bond yields and maturities | Normal vs. inverted yield curve |
Additional info: This guide integrates foundational concepts from the first chapters of a macroeconomics course, including the use of models, the PPF, opportunity cost, and introductory macroeconomic indicators such as inflation and interest rates. The examples and images provided reinforce the theoretical content with practical applications and real-world data.
