 Back
Backchapter 3
Study Guide - Smart Notes
 Tailored notes based on your materials, expanded with key definitions, examples, and context.
Economics: Foundations and Models
Three Key Economic Ideas
Economics is the study of how people make choices to attain their goals, given their scarce resources. Three foundational ideas guide economic thinking:
People Are Rational: Individuals and firms use all available information to achieve their objectives, weighing costs and benefits to make optimal decisions. Example: A company like Apple sets prices to maximize profit, not randomly.
People Respond to Economic Incentives: Changes in incentives alter behavior. Example: DNA databases for felons reduce repeat offenses, as the likelihood of being caught increases.
Optimal Decisions Are Made at the Margin: Most choices involve doing a little more or less of something. Marginal analysis compares the additional benefit (marginal benefit, MB) and additional cost (marginal cost, MC) of an action. Example: Deciding whether to study an extra hour or watch TV.
Markets and Economic Agents
A market is a group of buyers and sellers of a good or service and the institution or arrangement by which they come together to trade. Economic agents interact in markets, and their choices are analyzed using economic models.
Application: Incentives and Unintended Consequences
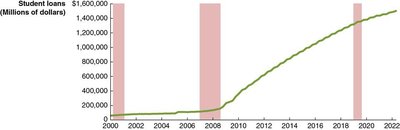
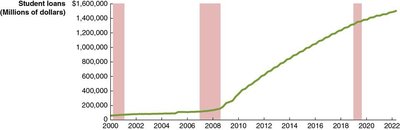
Government policies can change incentives, sometimes with unintended effects. For example, changes to federal student loan programs may encourage colleges to raise tuition or students to borrow more, knowing repayment burdens are reduced.
The Economic Problem That Every Society Must Solve
Scarcity, Trade-offs, and Opportunity Cost
Scarcity means unlimited wants exceed the limited resources available. This leads to trade-offs: producing more of one good means producing less of another. The opportunity cost is the highest-valued alternative given up to engage in an activity.
What to Produce? Societies must decide which goods and services to produce. Example: Funding space exploration may mean less funding for cancer research.
How to Produce? Firms choose production methods based on costs and available technology. Example: Using more machines versus more labor, or relocating production to lower-cost regions.
Who Receives Goods and Services? Distribution often depends on income, but government policies (taxes, welfare) can alter this distribution.
Types of Economic Systems
Centrally Planned Economy: The government decides how resources are allocated.
Market Economy: Households and firms interacting in markets determine resource allocation.
Mixed Economy: Most decisions result from market interactions, but the government plays a significant role. The U.S. is a mixed economy.
Efficiency and Equity
Productive Efficiency: Goods and services are produced at the lowest possible cost.
Allocative Efficiency: Production matches consumer preferences; the last unit provides a marginal benefit equal to its marginal cost.
Voluntary Exchange: Both buyers and sellers are made better off by transactions.
Equity: The fair distribution of economic benefits. There is often a trade-off between efficiency and equity.
Economic Models
Building and Testing Economic Models
Economists use models—simplified representations of reality—to analyze economic issues. The process involves:
Deciding on assumptions
Formulating a testable hypothesis
Using data to test the hypothesis
Revising the model if necessary
Retaining the model for future analysis if it fits the data
Models rely on assumptions about consumer and firm behavior, such as maximizing well-being or profit.
Positive vs. Normative Analysis
Positive Analysis: Concerned with "what is"—objective, fact-based analysis.
Normative Analysis: Concerned with "what ought to be"—value judgments and policy recommendations.
Economics as a Social Science
Economics studies individual and group behavior, similar to other social sciences, but with a focus on choices, prices, and the effects of policies.
Application: Tariffs
Economic theory can identify winners and losers from tariffs and estimate the net effects, but policy decisions may also involve normative judgments about fairness.
Microeconomics vs. Macroeconomics
Definitions and Scope
Microeconomics: The study of individual households and firms, their choices, and market interactions.
Macroeconomics: The study of the economy as a whole, including inflation, unemployment, and economic growth.
Examples of Microeconomic Issues | Examples of Macroeconomic Issues |
|---|---|
How consumers react to price changes How firms set prices Reducing opioid addiction AI's effect on costs and employment Reducing air pollution | Causes of recessions and unemployment Long-run economic growth Determinants of inflation Exchange rates Government intervention in recessions |
Economic Skills and Careers
Skills Gained from Studying Economics
Analyzing choices and their consequences
Advising on better decision-making
Forecasting trends and interpreting policy
Company/Organization | What an Economist Might Do |
|---|---|
Ford Motor Company | Forecast demand for electric cars |
Goldman Sachs | Forecast interest rates |
McDonald's | Decide on opening new restaurants |
Pfizer | Analyze costs and benefits of new treatments |
Wall Street Journal | Interpret monetary policy |
Federal Reserve Bank | Forecast employment and production trends |
Federal Trade Commission | Analyze effects of mergers |
World Bank | Evaluate development programs |
Economics Majors and Income
Median Wage, Early Career (22-27) | Median Wage, Midcareer (35-45) | |
|---|---|---|
Economics majors | $60,000 | $91,000 |
All majors | $45,000 | $72,000 |
Additional info: Higher earnings may reflect both the skills learned and self-selection of high-earning individuals into economics.
Important Economic Terms
Technology: The processes a firm uses to produce goods and services.
Capital: Manufactured goods used to produce other goods and services.
Appendix: Using Graphs and Formulas
Graphs in Economics
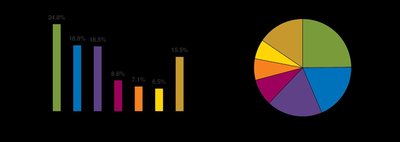
Graphs are simplified models that help visualize economic relationships. Common types include bar graphs, pie charts, and time-series graphs.

Plotting Economic Data
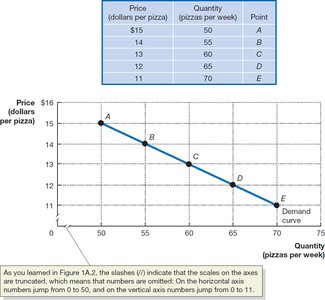
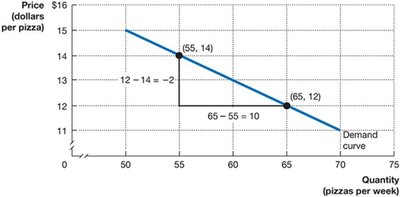
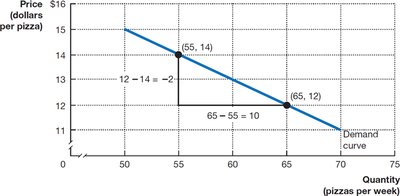
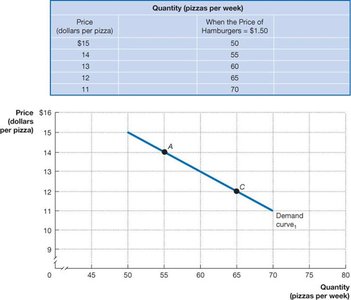
Graphs often plot price (vertical axis) against quantity (horizontal axis) to show relationships such as demand curves.
Calculating Slope
The slope of a line is the change in the y-axis variable divided by the change in the x-axis variable:
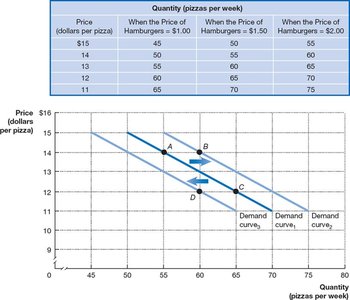
Shifting Demand Curves and Multiple Variables
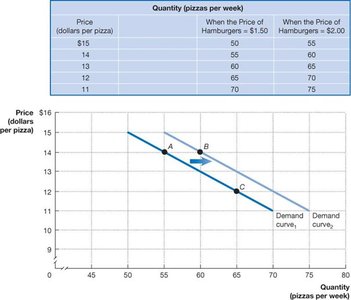
Graphs can show how changes in other variables (like the price of substitutes) shift demand curves.
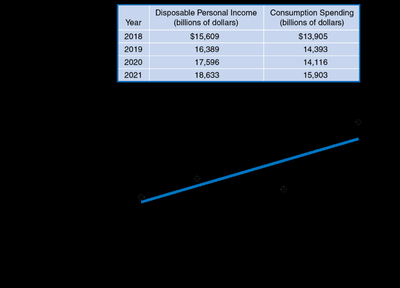
Positive and Negative Relationships
A positive relationship means both variables move in the same direction; a negative relationship means they move in opposite directions.
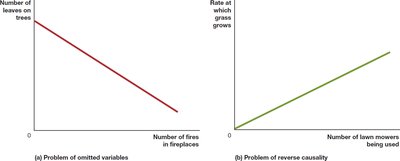
Cause and Effect in Graphs
Graphs can illustrate relationships but do not always prove causality. Omitted variables or reverse causality can mislead interpretations.
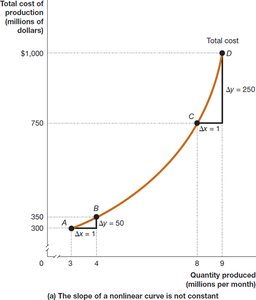
Linear and Nonlinear Relationships
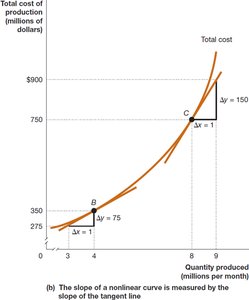
Most economic relationships are not perfectly linear. The slope of a nonlinear curve varies at different points and can be approximated by the slope of a tangent line.
Formulas in Economics
Percentage Change: Measures the change in a variable as a percentage of its initial value.
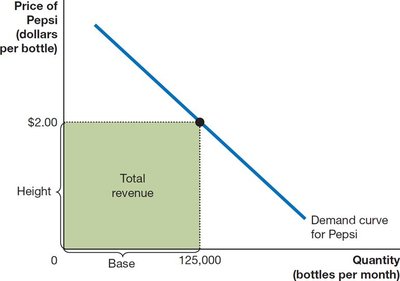
Area of a Rectangle: Used to calculate total revenue.
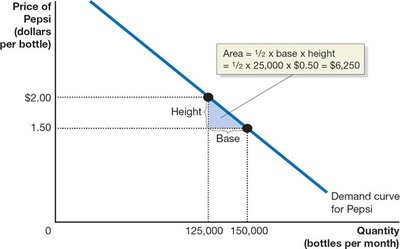
Area of a Triangle: Used in surplus calculations.
Steps for Using Formulas
Understand the economic concept the formula represents.
Use the correct formula for the problem.
Check that the result is economically reasonable.
