 Back
Backchapter 1
Study Guide - Smart Notes
 Tailored notes based on your materials, expanded with key definitions, examples, and context.
Economics: Foundations and Models
Three Key Economic Ideas
Economics is the study of how people make choices to attain their goals, given their scarce resources. Three foundational ideas guide economic thinking:
People Are Rational: Individuals and firms use all available information to achieve their objectives, weighing costs and benefits to make optimal decisions. For example, a company like Apple sets prices to maximize profit, not at random.
People Respond to Economic Incentives: Changes in incentives alter behavior. For instance, requiring DNA samples from felons reduced repeat offenses, showing even criminals respond to incentives.
Optimal Decisions Are Made at the Margin: Most choices involve doing a little more or less of something. Marginal analysis compares the additional benefit (marginal benefit, MB) and additional cost (marginal cost, MC) of an action. Decisions are optimal when MB = MC.
Market: A group of buyers and sellers of a good or service and the institution or arrangement by which they come together to trade.
The Economic Problem Every Society Must Solve
Scarcity means unlimited wants exceed limited resources, forcing societies to answer three fundamental questions:
What goods and services will be produced? Trade-offs are necessary; producing more of one good means less of another. The opportunity cost is the highest-valued alternative forgone.
How will goods and services be produced? Firms choose production methods based on costs and available technology, such as using more machines or relocating for cheaper labor.
Who will receive the goods and services produced? Distribution often depends on income, but government policies (taxes, welfare) can alter this distribution.
Types of Economic Systems
Centrally Planned Economy: The government decides how resources are allocated.
Market Economy: Households and firms interacting in markets determine resource allocation.
Mixed Economy: Most decisions result from market interactions, but the government plays a significant role. The U.S. is best described as a mixed economy.
Efficiency and Equity in Market Economies
Productive Efficiency: Goods and services are produced at the lowest possible cost, often due to competition.
Allocative Efficiency: Production matches consumer preferences; each good is produced up to the point where MB = MC.
Voluntary Exchange: Both buyers and sellers are made better off by transactions, continuing until no further gains are possible.
Equity: The fair distribution of economic benefits. There is often a trade-off between efficiency and equity, such as when taxes reduce incentives but fund social programs.
Economic Models and Analysis
How Economists Use Models
Economic models are simplified representations of reality used to analyze real-world situations. The process of building a model includes:
Deciding on assumptions
Formulating a testable hypothesis
Using data to test the hypothesis
Revising the model if necessary
Retaining the revised model for future analysis
Models rely on assumptions about behavior, such as consumers maximizing well-being and firms maximizing profit. Hypotheses are tested using economic data, but establishing causality can be challenging.
Positive vs. Normative Analysis
Positive Analysis: Concerned with what is (objective, testable statements).
Normative Analysis: Concerned with what ought to be (value judgments).
Economists primarily use positive analysis, but policy decisions often require normative judgments.
Microeconomics vs. Macroeconomics
Microeconomics: Studies individual households and firms, market interactions, and government influence on choices.
Macroeconomics: Studies the economy as a whole, including inflation, unemployment, and economic growth.
Examples of Microeconomic Issues | Examples of Macroeconomic Issues |
|---|---|
How consumers react to price changes | Why economies experience recessions |
How firms set prices | What determines inflation rates |
Reducing opioid addiction efficiently | What determines exchange rates |
Impact of AI on costs and employment | Can government reduce recession severity? |
Economic Skills and Careers
Skills Gained from Studying Economics
Analyzing choices and their consequences
Applying models to real-world problems
Interpreting data and making forecasts
Communicating complex ideas clearly
Economics majors often have higher median wages than other majors, but this may reflect both the skills learned and self-selection into the field.
Company/Organization | What an Economist Might Do |
|---|---|
Ford Motor Company | Forecast demand for electric cars |
Goldman Sachs | Forecast interest rates |
McDonald's | Decide on opening new restaurants |
Pfizer | Analyze costs and benefits of new treatments |
Federal Reserve | Forecast employment and production trends |
Important Economic Terms
Technology: The processes a firm uses to produce goods and services.
Capital: Manufactured goods used to produce other goods and services.
Pay close attention to definitions, as economic terms may differ from everyday usage.
Appendix: Using Graphs and Formulas
Graphs in Economics
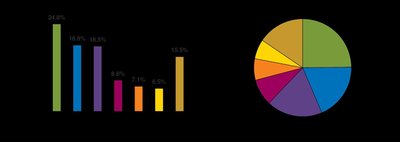
Graphs are visual models that help illustrate economic relationships. Common types include bar graphs, pie charts, and time-series graphs.

Plotting and Interpreting Economic Data
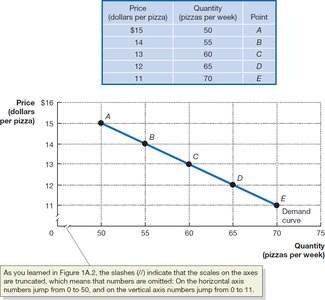
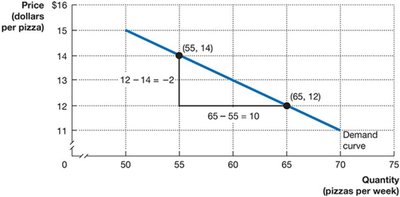
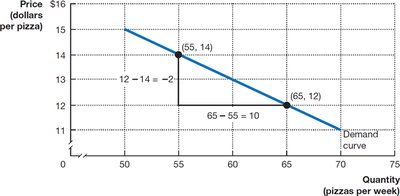
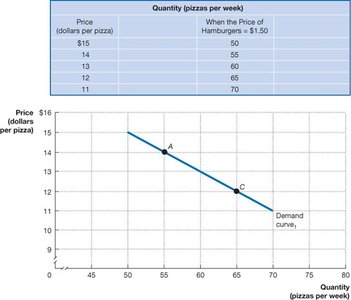
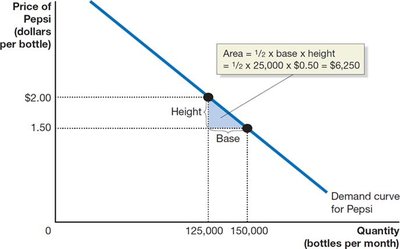
Graphs often plot price (vertical axis) against quantity (horizontal axis) to show demand or supply relationships. The slope of a line is calculated as:
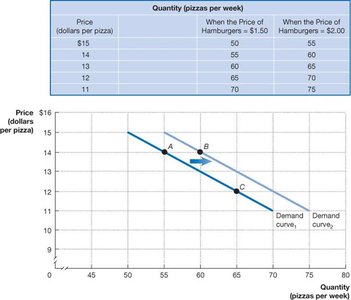
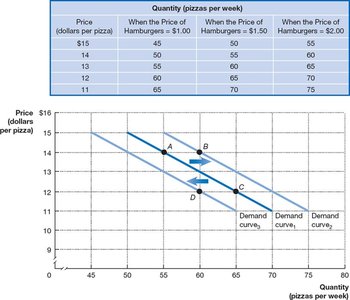
Shifting Demand Curves and Multiple Variables
Graphs can show how changes in other variables (like the price of substitutes) shift demand curves.
Positive and Negative Relationships
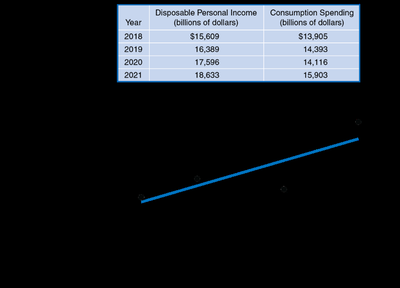
A positive relationship means both variables move in the same direction; a negative relationship means they move in opposite directions.
Cause and Effect in Graphs
Graphs can illustrate relationships but do not always prove causality. Problems include omitted variables and reverse causality.
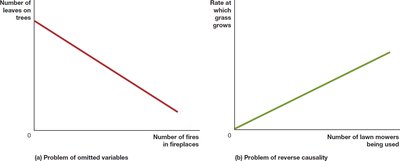
Linear vs. Nonlinear Relationships
Most economic relationships are not perfectly linear. The slope of a nonlinear curve varies at different points and can be approximated by tangent lines.
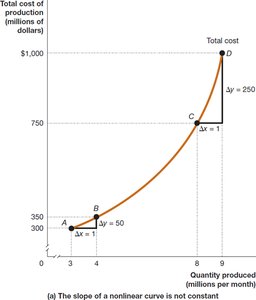
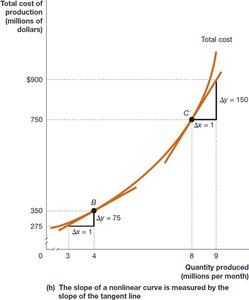
Key Formulas in Economics
Percentage Change:
Area of a Rectangle (Total Revenue):
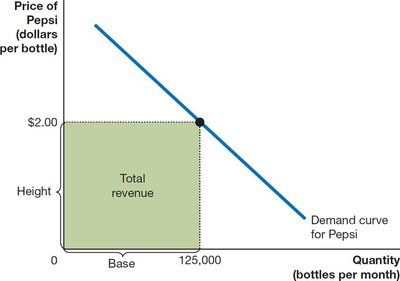
Area of a Triangle:
When using formulas, always ensure you understand the concept, use the correct formula, and check that your answer is reasonable.
