 Back
BackFrom the Short to the Medium Run: The IS-LM-PC Model (Chapter 9 Study Notes)
Study Guide - Smart Notes
 Tailored notes based on your materials, expanded with key definitions, examples, and context.
From the Short to the Medium Run: The IS-LM-PC Model
Introduction
This chapter explores how the IS-LM-PC model integrates the goods, financial, and labor markets to analyze the behavior of output and inflation from the short run to the medium run. The IS-LM-PC model is a cornerstone of modern macroeconomic analysis, providing a framework to understand how economies adjust over time and how policy interventions affect output and inflation.
Chapter Outline
9-1: Develops the IS-LM-PC Model
9-2: Shows how the economy adjusts from its short-run equilibrium to its medium-run equilibrium
9-3: Discusses complications and how things can go wrong
9-4: Looks at the dynamic effects of fiscal consolidation
9-5: Concludes
9-1 The IS-LM-PC Model
Overview
The IS-LM-PC model combines the IS-LM framework (goods and financial markets) with the Phillips Curve (labor market) to analyze output and inflation dynamics. This model helps explain how economies transition from short-run fluctuations to medium-run equilibrium.
IS Curve: In the short run, output is determined by demand. The IS curve represents equilibrium in the goods market.
LM Curve: Represents equilibrium in the financial market, relating the interest rate to output.
PC (Phillips Curve): Describes the relationship between inflation and unemployment, capturing labor market dynamics.
Key Equations
IS Curve:
Phillips Curve:
Natural Unemployment:
Potential Output:
Output Gap:
Graphical Representation
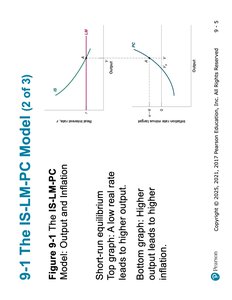
The IS-LM-PC model can be illustrated with graphs showing the relationship between output, the real interest rate, and inflation. In the short run, a low real interest rate leads to higher output, and higher output leads to higher inflation.
Further Derivations
Replacing with in the Phillips Curve gives:
Assuming wage setters expect inflation this year to be the same as last year, , we get:
When output is above potential (positive output gap), inflation increases, and vice versa.
Focus: Okun's Law across Time and Countries
Okun's Law
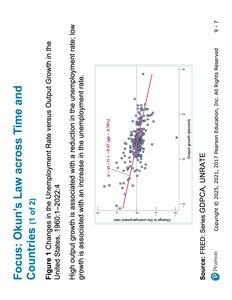
Okun's Law describes the empirical relationship between changes in the unemployment rate and output growth. It states that a reduction in the unemployment rate is associated with higher output growth, while an increase in unemployment is associated with lower output growth.
Key Points
Okun's Law can be written as the change in the unemployment rate is approximately equal to the negative of the growth rate of output:
The regression that fits the points in the figure is:
Annual output growth must be at least 3% to prevent the unemployment rate from rising.
Output growth 1% above normal leads only to a 0.4% reduction in the unemployment rate, due to factors such as labor hoarding and discouraged workers.
The coefficient (0.4) is called the Okun coefficient.
9-2 From the Short to the Medium Run
Adjustment to Medium Run
In the medium run, the economy converges to potential output and inflation converges to target inflation. The equilibrium interest rate at this point is called the natural rate of interest or Wicksellian rate of interest.
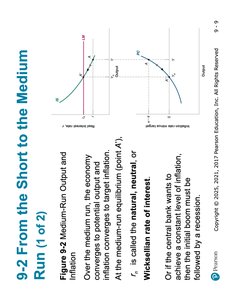
If the central bank wants to achieve constant (well-tied) inflation, the interest rate must be set at the natural rate, or a recession will follow.
Neutrality of Money
In the medium run, real variables are independent of monetary policy.
Monetary policy determines the rate of inflation and the nominal rate of interest.
The fact that monetary policy does not affect real variables in the medium run is referred to as the neutrality of money.
