 Back
BackGaining from International Trade: Macroeconomic Perspectives
Study Guide - Smart Notes
 Tailored notes based on your materials, expanded with key definitions, examples, and context.
International Trade and the U.S. Economy
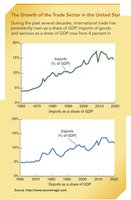
The Growth of the U.S. Trade Sector
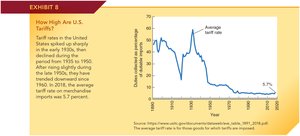
International trade has become an increasingly significant part of the U.S. economy over the past several decades. Both imports and exports have grown substantially as a share of GDP, more than doubling between 1960 and 2000. This growth has been driven by reductions in transportation and communication costs, as well as lower trade barriers.
Imports and exports as a share of GDP have increased, reflecting greater integration with the global economy.
Since 2000, the growth rate of the trade sector has slowed, but trade remains a vital component of economic activity.
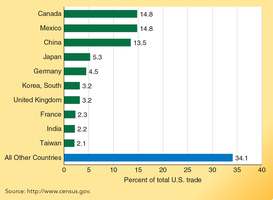
Leading Trading Partners of the U.S.
The United States trades most extensively with China, Canada, Mexico, and Japan. The impact of international trade varies across industries, with some U.S. sectors competing effectively and others facing challenges from foreign producers.
Canada and Mexico each account for 14.8% of total U.S. trade, followed by China at 13.5%.
Other significant partners include Japan, Germany, South Korea, and the United Kingdom.
Gains from Specialization and Trade
Overview of Gains from Trade
International trade is primarily conducted by individuals and firms, not governments. Trade occurs because both buyers and sellers expect to benefit. By specializing in goods they can produce efficiently, countries can trade for goods that would be more costly to produce domestically, increasing overall welfare.
Trade enables countries to consume beyond their domestic production possibilities.
Specialization according to comparative advantage leads to mutual gains.
Law of Comparative Advantage
The law of comparative advantage states that each country should specialize in producing goods for which it has the lowest opportunity cost, even if one country has an absolute advantage in all goods. This principle underpins the mutual benefits of trade.
Absolute advantage: Ability to produce more of a good with the same resources.
Comparative advantage: Ability to produce a good at a lower opportunity cost than another country.
Comparative Advantage: U.S. and Japan Example
The table below illustrates daily output per worker in the food and clothing industries for the U.S. and Japan, and the potential change in output if each country reallocates labor to its comparative advantage.
Country | Food (1) | Clothing (2) | Food (3) | Clothing (4) |
|---|---|---|---|---|
United States | 2 | 1 | +6 | -3 |
Japan | 3 | 9 | -3 | +9 |
Change in Total Output | +3 | +6 |
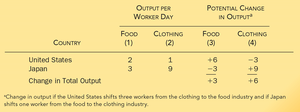
Example: If the U.S. shifts three workers from clothing to food and Japan shifts one worker from food to clothing, total output of both goods increases.
Production Possibilities Before Trade
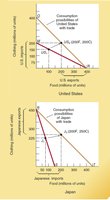
Without trade, each country’s consumption is limited to its production possibilities curve (PPC). The U.S. and Japan can only consume what they produce domestically, represented by points US1 and J1 on their respective PPCs.
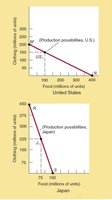
Trade Expands Consumption Possibilities
Specialization and trade allow countries to consume beyond their PPCs. By trading at mutually beneficial terms, both the U.S. and Japan can access more goods than they could produce alone.
The U.S. can specialize in food, Japan in clothing, and trade at a 1-for-1 rate.
This shifts their consumption possibilities outward, as shown by the O-N and R-T lines.

For example, the U.S. can increase its consumption from US1 to US2, gaining 50 million units of clothing and 100 million units of food. Japan can increase from J1 to J2, gaining 125 million units of food and 25 million units of clothing.

With specialization, the U.S. produces 400 million units of food, consumes 200 million, and exports 200 million to Japan. Japan produces 450 million units of clothing, consumes 250 million, and exports 200 million to the U.S. Both countries consume more than they could without trade.
Supply, Demand, and International Trade
U.S. Comparative Advantage: Export Markets
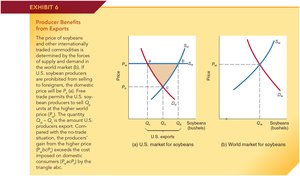
The price of internationally traded commodities, such as soybeans, is determined by global supply and demand. If U.S. producers can sell at the higher world price, they export the surplus, benefiting from increased producer surplus.
Without trade, the domestic price is lower (Pn).
With trade, the price rises to the world price (Pw), and the quantity exported is Qp – Qc.
Producer surplus increases by the area between Pw and Pn, minus the loss to consumers.

Foreign Comparative Advantage: Import Markets
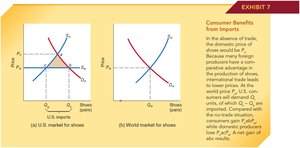
When foreign producers have a comparative advantage, international trade lowers domestic prices and increases consumer surplus. For example, in the shoe market, imports allow U.S. consumers to buy at the lower world price (Pw).
Consumers gain from lower prices and increased variety.
Domestic producers lose some market share, but the net gain to society is positive.

The Economics of Trade Restrictions
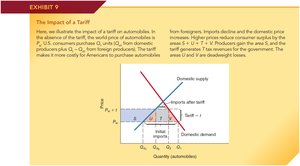
Tariffs and Their Impact
Tariffs are taxes on imports that raise the domestic price of foreign goods. This benefits domestic producers and generates government revenue but reduces consumer surplus and creates deadweight losses.
Tariffs raise the price from Pw to Pw + t, reducing imports and increasing domestic production.
Consumers lose more than producers and the government gain, resulting in net welfare loss.
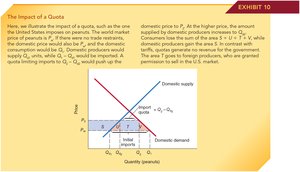
Quotas and Their Impact
Quotas limit the quantity of imports, raising domestic prices and benefiting domestic producers and foreign producers with import permits. Like tariffs, quotas reduce consumer surplus and create deadweight losses.
Quotas push the domestic price above the world price, reducing imports and increasing domestic production.
Consumers lose, while producers and permit holders gain.
Arguments for Trade Restrictions
Common arguments for trade restrictions include protecting domestic jobs, national security, and preventing dumping. However, these often serve special interests and impose hidden costs on the broader public.
Protectionism benefits a small group at the expense of the general population.
Lower prices from imports benefit consumers, even if some domestic producers are harmed.
Trade Openness, Economic Freedom, and Growth
Economic Freedom and Institutional Quality
Economic freedom—characterized by voluntary exchange, market allocation, and protection of property rights—supports gains from trade, entrepreneurship, and investment. Countries with higher economic freedom tend to experience higher income and growth rates.
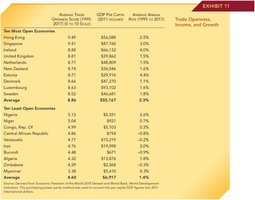
Trade Openness, Income, and Growth
Empirical evidence shows that more open economies achieve higher income levels and faster growth. The table below compares the ten most and least open economies by average trade openness, GDP per capita, and annual growth rates.
Country | Average Trade Openness Score | GDP Per Capita (2011 dollars) | Average Annual Real GDP Growth (1995 to 2011) |
|---|---|---|---|
Hong Kong | 8.89 | $56,068 | 2.1% |
Singapore | 8.81 | $51,709 | 3.5% |
Ireland | 8.41 | $41,684 | 3.7% |
United Kingdom | 8.18 | $36,120 | 1.9% |
New Zealand | 8.17 | $29,849 | 2.1% |
Switzerland | 8.13 | $44,731 | 1.6% |
Denmark | 8.09 | $38,560 | 1.6% |
Sweden | 8.07 | $36,307 | 2.2% |
Austria | 8.06 | $38,681 | 2.0% |
Germany | 8.03 | $38,449 | 1.5% |
Average (Most Open) | 8.39 | $41,716 | 2.2% |
Nigeria | 5.19 | $5,583 | 2.1% |
Niger | 5.12 | $1,016 | 0.7% |
Congo, Rep. Of | 4.99 | $2,693 | -1.6% |
Central African Republic | 4.89 | $1,011 | -0.7% |
Algeria | 4.88 | $7,019 | 1.7% |
Burundi | 4.80 | $502 | -0.7% |
Myanmar | 4.79 | $1,221 | 1.5% |
Bangladesh | 4.70 | $1,574 | 3.9% |
Angola | 4.60 | $5,417 | 1.5% |
Philippines | 4.60 | $3,477 | 1.9% |
Average (Least Open) | 4.96 | $3,851 | 1.2% |
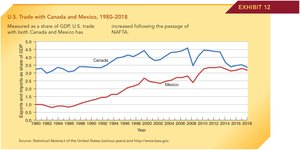
U.S. Trade with Canada and Mexico
Following the passage of NAFTA, U.S. trade with Canada and Mexico increased sharply as a share of GDP, demonstrating the impact of trade agreements on economic integration and performance.
Trade Barriers and Popular Trade Fallacies
Trade Fallacies
Many misconceptions about trade arise from ignoring secondary effects. For example, restricting imports also restricts exports, as international trade is a system of interlinked flows. Policies that attempt to protect domestic industries often have unintended negative consequences for the broader economy.
Trade restrictions may benefit specific groups but reduce overall economic welfare.
Open economies tend to perform better in terms of income and growth.
