 Back
BackIntroduction to Macroeconomics and Gross Domestic Product (GDP)
Study Guide - Smart Notes
 Tailored notes based on your materials, expanded with key definitions, examples, and context.
Introduction to Macroeconomics
Macroeconomics vs. Microeconomics
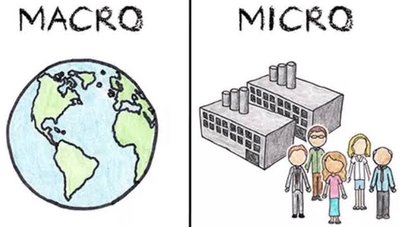
Macroeconomics is the branch of economics that studies the behavior and performance of an entire economy, focusing on aggregate measures such as total output, income, and employment. In contrast, microeconomics examines the decisions of individual households and firms. The distinction lies in the scale: macroeconomics analyzes the economy as a whole, while microeconomics focuses on smaller, individual units.
Economic Aggregates: Variables or metrics that represent the sum of many smaller individual economic activities (e.g., GDP, unemployment rate, inflation).
Observation and Measurement: Government agencies track these aggregates to monitor the macroeconomy.
Core Goal: Develop theories and models to understand why these aggregates behave as they do.
Defining Gross Domestic Product (GDP)
What is GDP?
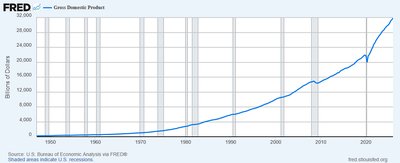
Gross Domestic Product (GDP) is the most comprehensive measure of a nation's total economic activity. It represents the total value of all final goods and services produced within a country's borders over a specific period, typically a year or a quarter.
Goods & Services: Includes both tangible products (e.g., cars, computers) and intangible services (e.g., education, healthcare).
In advanced economies like the United States, services make up more than half of total production.
Intermediate vs. Final Goods
To avoid double counting in GDP calculations, only final goods and services are included. Intermediate goods—those used as inputs in the production of other goods—are excluded because their value is already embedded in the price of final goods.
Intermediate Goods: Inputs used to produce other goods (e.g., steel for cars, flour for bread).
Final Goods: Goods and services purchased by the end user (e.g., a finished car, a loaf of bread).
Rule: GDP counts only final goods to accurately reflect total production value.
Aggregating Value via Market Prices
Because economies produce a wide variety of goods and services, GDP aggregates these using market prices as a common metric. This allows for the comparison and summation of diverse products and services.
Market Pricing Principle: The value of each good or service is determined by its market price, reflecting society's willingness to pay.
Unit of Measure: In the U.S., GDP is measured in dollars.
Nominal vs. Real GDP
Understanding the Distinction
GDP can increase either because more goods and services are produced or because prices have risen (inflation). To distinguish between these effects, economists use two measures:
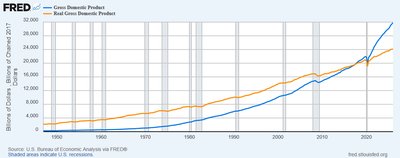
Nominal GDP: Measured using current market prices; includes both changes in quantity and price (not adjusted for inflation).
Real GDP: Adjusted for inflation by using constant prices from a base year; reflects only changes in actual output.
Visualizing Inflation Adjustment
Because prices generally rise over time, Real GDP is typically lower than Nominal GDP after the base year. In the base year, both measures are identical. The gap between Nominal and Real GDP reflects the cumulative effect of inflation.
GDP Per Capita and Long-Run Growth
Measuring Living Standards
GDP per capita divides total Real GDP by the population, providing a measure of average economic output per person. This is a key indicator of living standards and productivity improvements over time.
Long-Run Growth: U.S. Real GDP per capita has shown resilient growth over the long term, despite short-term shocks like the Great Depression.
Short-Term Fluctuations: Major events (e.g., financial crises, pandemics) can cause temporary declines, but the long-run trend is upward.
Fluctuations and the Business Cycle
The Business Cycle
The business cycle refers to the short-run fluctuations in economic activity around the long-run growth trend. These include periods of expansion (growth) and contraction (recession).
Key Features: Upswings (booms), downswings (recessions), and recoveries.
Labor Market Shocks and GDP Measurement
Impact of Shocks
Major disruptions, such as financial crises or pandemics, can cause large numbers of people to leave the workforce. This can make GDP per capita appear to fall sharply, even if individual worker productivity has not changed significantly.
Measurement Caveat: A drop in GDP per capita may reflect a shrinking labor force rather than a collapse in productivity.
GDP Growth Rate Formula
The GDP growth rate measures the percentage change in Real GDP from one year to the next, capturing the pace of economic expansion or contraction.
Formula:
Measuring Inflation and the Price Level
Tracking Inflation
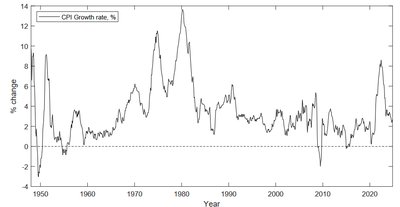
Nominal GDP reflects both price and quantity changes, while Real GDP isolates quantity. The widening gap between the two over time is used to measure inflation—the general rise in price levels.
General Trend: Over long periods, price levels tend to rise steadily (inflation).
Deflation: Occurs when the overall price level falls.
Global Differences in Economic Prosperity
Comparing Regions
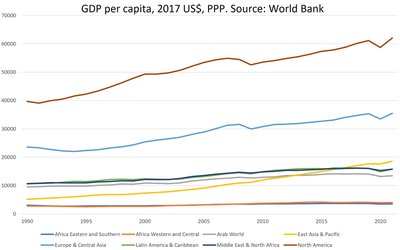
While most countries experience positive economic growth, many lower-income regions are not growing quickly enough to close the gap with advanced economies. This results in persistent differences in living standards across the globe.
Advanced Economies: U.S. and Western Europe have much higher GDP per capita than developing regions.
Growth Disparities: Some regions lag behind due to slower growth rates.
