 Back
BackJobs and Unemployment: Labor Market Indicators, Trends, and Full Employment
Study Guide - Smart Notes
 Tailored notes based on your materials, expanded with key definitions, examples, and context.
Jobs and Unemployment
Introduction
This chapter explores the measurement and analysis of unemployment and labor market performance in the United States. It covers the definitions of key labor market indicators, trends in unemployment, types of unemployment, and the concept of full employment. Understanding these concepts is essential for analyzing macroeconomic performance and policy.
Labor Market Indicators
Defining the Labor Force and Population
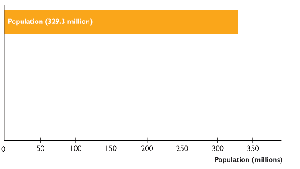
The labor market is analyzed using data collected by the Bureau of Labor Statistics (BLS) and the Census Bureau through the Current Population Survey. The survey classifies individuals into categories based on their employment status.
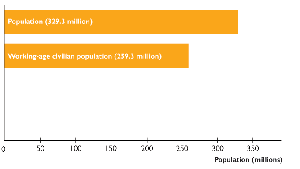
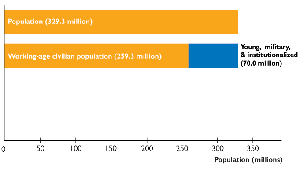
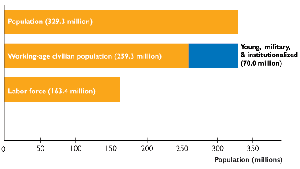
Working-age population: All people aged 16 and over, not in institutional care or the armed forces.
Labor force: The sum of employed and unemployed individuals.
Not in the labor force: Working-age individuals who are neither employed nor actively seeking work.
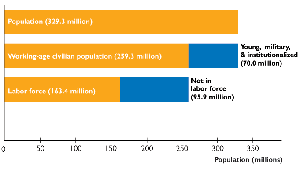
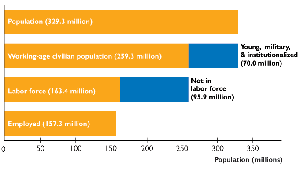
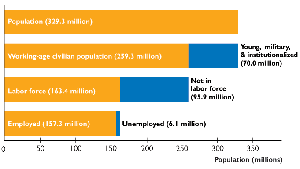
Criteria for Employment and Unemployment
Employed: Individuals who worked at least one hour for pay, worked 15+ hours unpaid in a family business, or were temporarily absent from a job.
Unemployed: Individuals without a job who are available for work and have made specific efforts to find employment in the past four weeks, or are waiting to be recalled from a layoff.
Key Labor Market Indicators
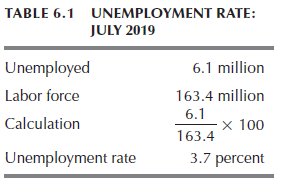
Unemployment Rate: The percentage of the labor force that is unemployed.
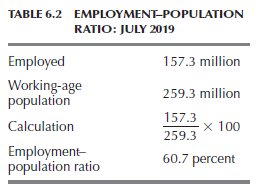
Employment–Population Ratio: The percentage of the working-age population that is employed.
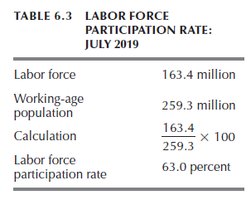
Labor Force Participation Rate: The percentage of the working-age population that is in the labor force.
Formulas
Unemployment Rate:
Employment–Population Ratio:
Labor Force Participation Rate:
Example Calculations (July 2019)
Indicator | Value | Calculation | Result |
|---|---|---|---|
Unemployment Rate | 6.1 million unemployed, 163.4 million labor force | 6.1 / 163.4 × 100 | 3.7% |
Employment–Population Ratio | 157.3 million employed, 259.3 million working-age | 157.3 / 259.3 × 100 | 60.7% |
Labor Force Participation Rate | 163.4 million labor force, 259.3 million working-age | 163.4 / 259.3 × 100 | 63.0% |
Alternative Measures of Unemployment
Marginally attached workers: Not working, available for work, but not actively seeking employment in the past four weeks.
Discouraged workers: Marginally attached workers who stopped looking due to unsuccessful job searches.
Part-time for economic reasons: Individuals working part-time but desiring full-time employment (involuntary part-time).
Including these groups in unemployment calculations results in higher, broader measures of labor underutilization (e.g., U-4, U-5, U-6).
Labor Market Trends and Fluctuations
Historical Unemployment Trends
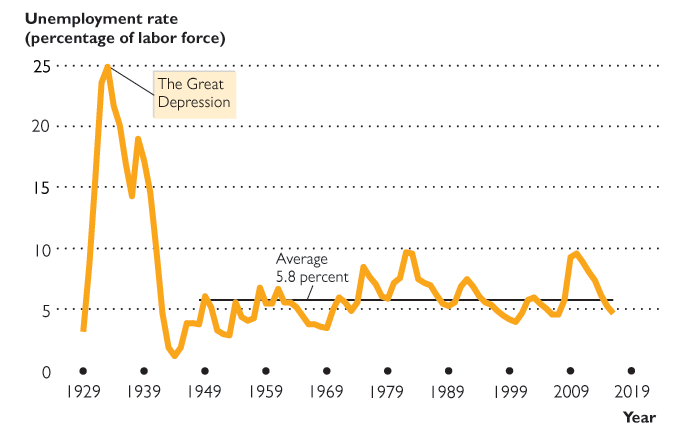
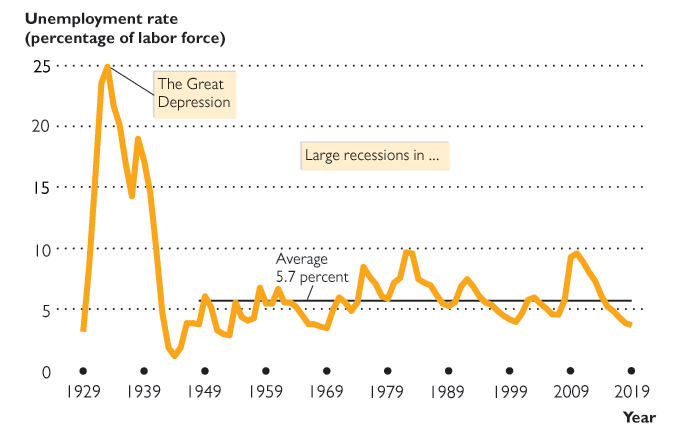
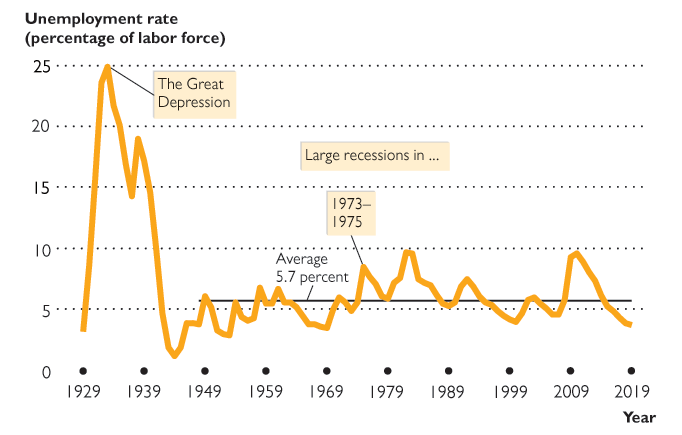
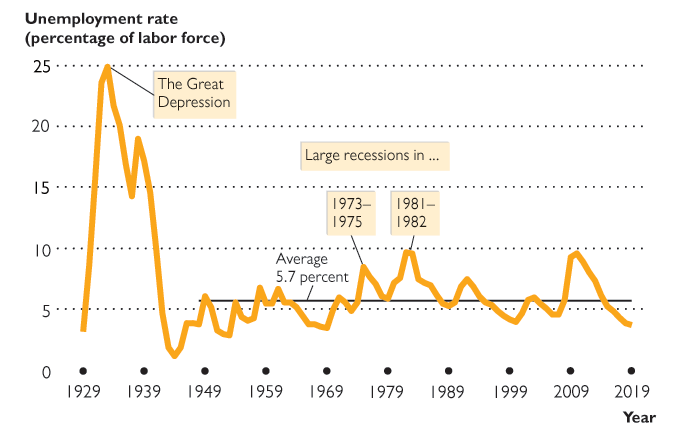
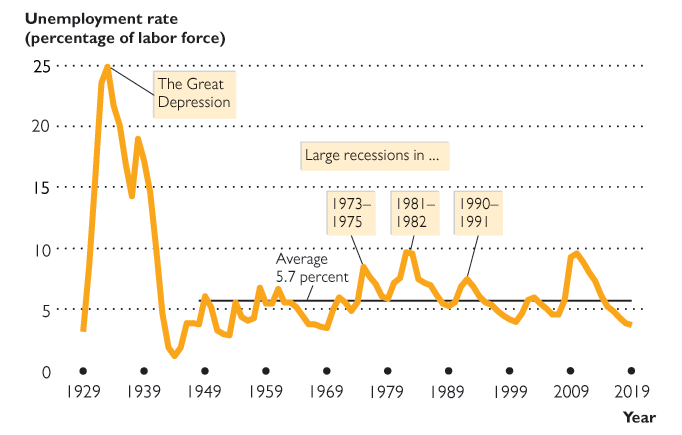
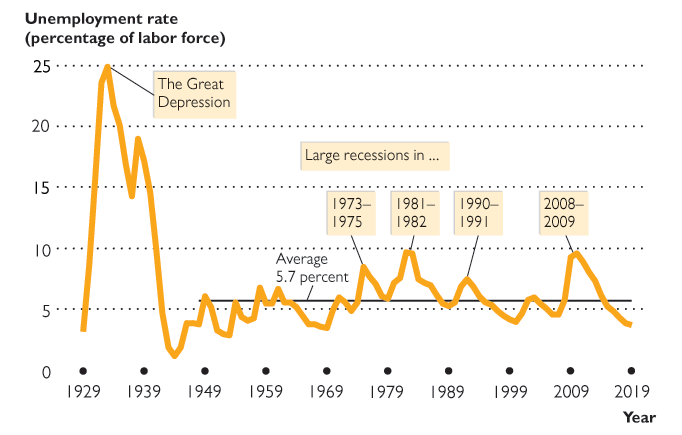
The unemployment rate fluctuates with the business cycle, rising during recessions and falling during expansions. The average U.S. unemployment rate from 1948 to 2019 was about 5.7%.
Major U.S. Recessions and Causes
Great Depression (1929–1939): Triggered by the 1929 stock market crash, bank failures, and deflation.
1973–1975 Recession: Caused by the OPEC oil embargo and stagflation.
1981–1982 Recession: Resulted from the energy crisis and tight monetary policy.
1990–1991 Recession: Sparked by oil price spikes and a credit crunch.
2008–2009 Recession: Caused by the housing market collapse and financial crisis.
2020 Recession: Resulted from the COVID-19 pandemic and economic shutdowns.
Labor Force Participation Trends
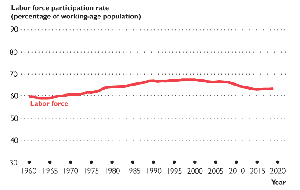
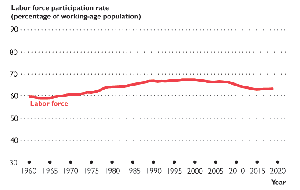
The labor force participation rate increased from 59% in 1960 to a peak of 67% in 1999, driven largely by increased participation among women. Since then, it has declined slightly. The participation rate for men has gradually decreased over time.
Alternative Unemployment Measures (U-1 to U-6)
The BLS reports several measures of unemployment:
U-1: Unemployed for 15 weeks or more
U-2: People laid off or with temporary jobs
U-3: Official unemployment rate (actively seeking work)
U-4: U-3 plus discouraged workers
U-5: U-4 plus other marginally attached workers
U-6: U-5 plus part-time for economic reasons
U-3 is the most commonly reported rate due to its simplicity and more favorable depiction of the labor market.
Unemployment and Full Employment
Types of Unemployment
Frictional Unemployment: Short-term unemployment from normal labor market turnover (e.g., new graduates, job changes).
Structural Unemployment: Unemployment from changes in technology or international competition that alter job requirements or locations.
Cyclical Unemployment: Unemployment that rises during recessions and falls during expansions, reflecting the business cycle.
Natural Unemployment and Full Employment
Natural Unemployment: The sum of frictional and structural unemployment when there is no cyclical unemployment.
Natural Unemployment Rate: The natural unemployment as a percentage of the labor force.
Full Employment: Occurs when the actual unemployment rate equals the natural unemployment rate (no cyclical unemployment).
Major influences on the natural unemployment rate include the age distribution of the population, the pace of structural change, the real wage rate, and unemployment benefits.
Unemployment, Real GDP, and the Output Gap
Potential GDP: The value of real GDP when the economy is at full employment.
Output Gap: The difference between real GDP and potential GDP, expressed as a percentage of potential GDP.
When the unemployment rate is above the natural rate, real GDP is below potential GDP (negative output gap). When the unemployment rate is below the natural rate, real GDP is above potential GDP (positive output gap).
Output Gap Formula
Alternative Measures of Labor Utilization: Z-Pop Ratio
The Z-Pop ratio, suggested by the Atlanta Fed, measures the percentage of the working-age population that is fully utilized (working full-time, working part-time for non-economic reasons, or not wanting a job). This measure can provide a slightly different perspective on labor market health compared to the unemployment rate.
Practice Questions
If the total labor force is 160 million and the number of unemployed individuals is 8 million, what is the unemployment rate? Answer: 5% ()
The working-age population of a country is 250 million, and the number of employed individuals is 150 million. What is the employment-population ratio? Answer: 60% ()
If a country has a working-age population of 200 million and its labor force consists of 140 million people, what is its labor force participation rate? Answer: 70% ()
If the unemployment rate increases while the labor force participation rate remains the same, which of the following is most likely true? Answer: More people in the labor force have lost their jobs.
If the employment-population ratio decreases while the labor force participation rate remains constant, what does this imply? Answer: The unemployment rate has increased.
Additional info: These notes include expanded explanations, formulas, and examples to ensure a comprehensive understanding of labor market indicators and their macroeconomic significance.
