 Back
BackMacroeconomic Measurement and the Goods Market: Study Notes
Study Guide - Smart Notes
 Tailored notes based on your materials, expanded with key definitions, examples, and context.
Gross Domestic Product (GDP)
Measuring GDP
Gross Domestic Product (GDP) is a fundamental indicator of a country's economic activity, representing the total value of all final goods and services produced within a nation during a specific period. There are three primary approaches to measuring GDP:
Value-Added Approach: GDP is calculated as the sum of value added by labor to goods and services across all productive units. This method involves adding the value of all final goods and services and subtracting the value of intermediate goods used in production. For government services not sold at market prices, such as national defense, their value is estimated by the cost of inputs.
Expenditure Approach: GDP is measured as the total spending on all final goods and services. The formula is , where C is consumption, I is investment, G is government spending, and NX is net exports. Spending on intermediate goods is excluded.
Income Approach: GDP is the sum of all income received by economic agents contributing to production, including wages, after-tax profits, interest, taxes, and depreciation. The formula is .
Nominal and Real GDP
Nominal GDP measures the value of output using current prices, while Real GDP uses constant prices to account for inflation. Real GDP is constructed as the sum of the quantities of final goods multiplied by base year prices.
Nominal GDP: Increases over time due to both higher production and rising prices.
Real GDP: Reflects only changes in production, holding prices constant.
Base Year Effects: The choice of base year affects real GDP calculations because relative prices change over time.
Chain-Weighted GDP: Uses a geometric average of growth rates between consecutive years to "chain" real GDP, making growth rates independent of the base year.
Unemployment and Inflation
Unemployment Rate
The unemployment rate is a key indicator of labor market health. It is calculated as the ratio of unemployed individuals to the total labor force.
Employment (N): Number of people with jobs.
Unemployment (U): Number of people without jobs but actively seeking work.
Labor Force (L):
Unemployment Rate (u):
Participation Rate:
Discouraged Workers: Individuals who stop looking for work are not counted as unemployed.
Inflation Rate
Inflation is a sustained rise in the general price level. The inflation rate measures how quickly prices increase, while deflation is a sustained decline in prices.
Price Index: Weighted average of observed prices, used to measure the price level.
Common Price Indices:
Implicit GDP Price Deflator: Measures prices of goods produced domestically.
Consumer Price Index (CPI): Measures prices of goods consumed domestically.
Personal Consumption Expenditures Price Index (PCEPI): Another measure of consumer prices.
Differences: CPI can rise faster than GDP Deflator when imported goods' prices increase, but both indices usually move together.
Goods Market and Aggregate Expenditure
Components of GDP (Expenditure Approach)
In the United States, consumption is the largest component of GDP. The relationship between income and consumption is central to macroeconomic models.
Consumption Function: , where Y is income, T is net tax revenue, c_1 is the marginal propensity to consume (MPC), and c_0 is autonomous consumption.
Aggregate Expenditure: (in a closed economy, )
Equilibrium: Output equals aggregate expenditure (). Disequilibrium occurs when .
Goods Market Equilibrium
The goods market equilibrium is where aggregate output equals aggregate expenditure. If output is below equilibrium, expenditure exceeds output, leading to inventory depletion and increased production. If output is above equilibrium, inventories accumulate and production decreases.
Endogenous Variables: Variables determined within the model (Y, C, I, G, T).
Exogenous Variables: Variables determined outside the model (parameters, policy changes).
The Multiplier Effect
An exogenous change in expenditure (such as government spending) leads to a multiplied change in equilibrium output. This is known as the Keynesian multiplier.
Multiplier Formula:
Government Spending Multiplier:
Example: If c_1 = 0.25\Delta Y = \frac{1}{0.75} \times
Equilibrium Output and Other Multipliers
Equilibrium output is determined by the goods market equations. Changes in exogenous variables affect output according to their respective multipliers.
Equilibrium Output Formula:
Government Spending Multiplier:
Investment Multiplier:
Tax Multiplier:
Goods Market Graphs
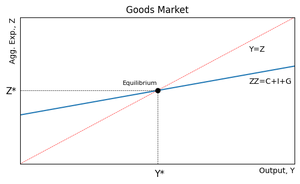
Goods market graphs illustrate the relationship between output (Y) and aggregate expenditure (Z). The equilibrium is where the aggregate expenditure function (ZZ) intersects the 45-degree line ().
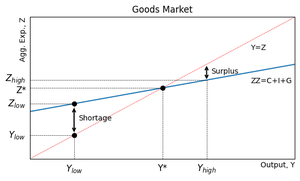
When output is below equilibrium, there is a shortage (excess expenditure). When output is above equilibrium, there is a surplus (excess supply).
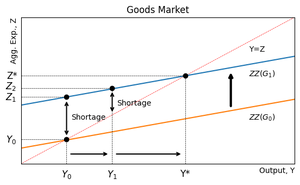
Policy Experiment: Government Spending Increase
An increase in government spending shifts the aggregate expenditure curve (ZZ) upward, creating excess expenditure and leading to increased production until a new equilibrium is reached.
Savings and Investment
Definitions and Relationships
Savings and investment are closely linked in macroeconomic equilibrium. Private saving is disposable income not consumed, while public saving is net tax revenue minus government spending.
Private Saving:
Public Saving:
National Saving:
Investment: (in a closed economy)
Open Economy:
Key Point: In equilibrium, investment equals saving, ensuring that all income not consumed is used for productive purposes.
