 Back
BackMacroeconomic Principles: Core Concepts and the Loanable Funds Market
Study Guide - Smart Notes
 Tailored notes based on your materials, expanded with key definitions, examples, and context.
Economics: Foundations and Models
Scarcity and Economic Choice
Economics is the study of how people make choices to attain their goals, given their scarce resources. Scarcity means that unlimited wants exceed the limited resources available to fulfill those wants, leading to the necessity of making choices and trade-offs.
Scarcity: The fundamental economic problem of having seemingly unlimited human wants in a world of limited resources.
Trade-off: Choosing more of one good or service means producing less of another due to limited resources.
Opportunity Cost: The highest-valued alternative that must be given up to engage in an activity.
Economic Models: Simplified versions of reality used to analyze real-world economic situations.
Three Key Economic Ideas
People are rational: Individuals use all available information to achieve their goals.
People respond to incentives: Changes in costs and benefits influence behavior.
Optimal decisions are made at the margin: Most choices involve doing a little more or a little less of something.
Types of Economic Systems
Centrally Planned, Market, and Mixed Economies
Centrally Planned Economy: The government decides how resources are allocated.
Market Economy: Households and firms interacting in markets allocate resources.
Mixed Economy: Most decisions are made by markets, but the government plays a significant role.
Efficiency in Market Economies
Productive Efficiency: Goods and services are produced at the lowest possible cost.
Allocative Efficiency: Production is in accordance with consumer preferences.
Voluntary Exchange: Transactions make both buyers and sellers better off.
Production Possibilities Frontier (PPF) and Opportunity Cost
Understanding the PPF
The Production Possibilities Frontier (PPF) is a curve showing the maximum attainable combinations of two goods that can be produced with available resources and technology. It illustrates the concept of opportunity cost and trade-offs.
Points on the PPF are efficient; points inside are inefficient; points outside are unattainable.
Shifts in the PPF represent economic growth.
Comparative Advantage and Trade
Absolute vs. Comparative Advantage
Absolute Advantage: The ability to produce more of a good with the same resources.
Comparative Advantage: The ability to produce a good at a lower opportunity cost than others.
Trade allows individuals or countries to specialize in goods where they have a comparative advantage, increasing overall efficiency and welfare.
The Market System
How Markets Work
Market: A group of buyers and sellers of a good or service and the institution or arrangement by which they come together to trade.
Households: Provide factors of production (labor, capital, natural resources, entrepreneurial ability).
Firms: Supply goods and services to product markets; buy factors of production from households.
The Circular-Flow Diagram
Illustrates the flow of resources, products, and money in an economy.
Shows the interaction between households and firms in factor and product markets.
Measuring Economic Activity: GDP and Its Components
Gross Domestic Product (GDP)
GDP: The market value of all final goods and services produced within a country in a given period.
Excludes intermediate goods to avoid double counting.
Counts only new production within the country’s borders.
Expenditure Approach to GDP
Consumption (C): Spending by households on goods and services.
Investment (I): Spending on capital equipment, inventories, and structures.
Government Purchases (G): Spending by governments on goods and services.
Net Exports (NX): Exports minus imports.
GDP formula:
Real vs. Nominal GDP
Nominal GDP: Values output using current prices.
Real GDP: Values output using the prices of a base year to remove the effects of inflation.
GDP Deflator formula:
Unemployment and Inflation
Measuring Unemployment
Unemployment Rate:
Labor Force Participation Rate:
Employment-Population Ratio:
Types of Unemployment
Frictional Unemployment: Short-term, matching workers with jobs.
Structural Unemployment: Mismatch between skills and job requirements.
Cyclical Unemployment: Caused by business cycle downturns.
Measuring Inflation
Inflation Rate: The percentage increase in the price level from one year to the next.
Consumer Price Index (CPI): Measures the average price of a basket of goods and services consumed by households.
Producer Price Index (PPI): Measures the average price received by producers for their output.
Inflation Rate formula:
Long-Run Economic Growth and the Financial System
Determinants of Long-Run Growth
Labor Productivity: Output per worker or per hour worked.
Capital per Hour Worked: More capital increases productivity.
Technological Change: Improvements in technology boost productivity.
Property Rights: Secure property rights encourage investment and innovation.
The Financial System
Financial Markets: Where securities like stocks and bonds are bought and sold.
Financial Intermediaries: Institutions like banks and mutual funds that channel funds from savers to borrowers.
Key Services: Risk sharing, liquidity, and information aggregation.
The Market for Loanable Funds
Loanable Funds Model
The market for loanable funds brings together savers (suppliers of funds) and borrowers (demanders of funds). The real interest rate adjusts to balance the supply and demand for loanable funds.
Supply of Loanable Funds: Comes from households and sometimes the government (when there is a budget surplus).
Demand for Loanable Funds: Comes from firms and the government (when there is a budget deficit).
Equilibrium: The real interest rate at which the quantity of loanable funds supplied equals the quantity demanded.
Shifts in the Loanable Funds Market
An increase in demand for loanable funds (e.g., due to technological change) raises the real interest rate and the quantity of funds loaned.
An increase in supply (e.g., higher savings) lowers the real interest rate and increases the quantity of funds loaned.
A decrease in supply (e.g., government budget deficit) raises the real interest rate and decreases the quantity of funds loaned (crowding out).
Event | Effect on Supply/Demand | Effect on Real Interest Rate | Effect on Quantity of Loanable Funds |
|---|---|---|---|
Increase in demand | Demand curve shifts right | Increases | Increases |
Decrease in demand | Demand curve shifts left | Decreases | Decreases |
Increase in supply | Supply curve shifts right | Decreases | Increases |
Decrease in supply | Supply curve shifts left | Increases | Decreases |
Graphical Representation of Shifts in the Loanable Funds Market
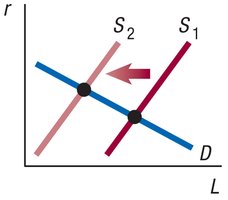
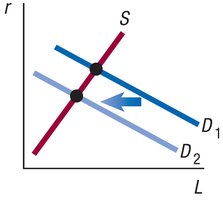
The following images illustrate the effects of shifts in supply and demand in the market for loanable funds:
Decrease in Supply of Loanable Funds: The supply curve shifts left, increasing the real interest rate and decreasing the quantity of loanable funds.
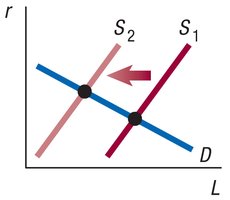
Decrease in Supply of Loanable Funds (alternative illustration): Another depiction of the supply curve shifting left.
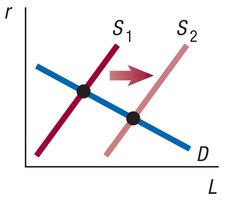
Increase in Supply of Loanable Funds: The supply curve shifts right, decreasing the real interest rate and increasing the quantity of loanable funds.
Increase in Demand for Loanable Funds: The demand curve shifts right, increasing the real interest rate and the quantity of loanable funds.
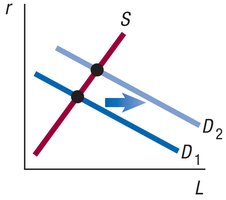
Decrease in Demand for Loanable Funds: The demand curve shifts left, decreasing the real interest rate and the quantity of loanable funds.
The Business Cycle
Phases of the Business Cycle
Expansion: Period when total production and employment are increasing.
Recession: Period when total production and employment are decreasing.
The business cycle affects inflation and unemployment rates, with inflation typically rising during expansions and falling during recessions.
The Great Moderation
Refers to the period of reduced volatility in economic output and employment since the mid-1980s.
Attributed to factors such as the increasing importance of services, government stabilization policies, and a more stable financial system.
Additional info: The above notes synthesize and expand upon the provided lecture and textbook content, ensuring coverage of all major macroeconomic principles relevant to a college-level course.
