Back
BackMacroeconomics Chapter 1: Introduction – Key Concepts and Canadian Data
Study Guide - Smart Notes
 Tailored notes based on your materials, expanded with key definitions, examples, and context.
Introduction to Macroeconomics
Overview of Macroeconomics
Macroeconomics is the branch of economics that studies the behavior and performance of an economy as a whole. It focuses on aggregate economic activity, long-run economic growth, and short-run business cycle fluctuations. Understanding macroeconomics is essential for analyzing national income, employment, inflation, and government policies.
Aggregate Economic Activity: Refers to the total output, income, and expenditure in an economy.
Long-Run Performance: Examines economic growth and improvements in living standards over time.
Short-Run Fluctuations: Studies business cycles, including recessions and expansions.
Measuring Aggregate Economic Activity
Gross Domestic Product (GDP)
GDP is a fundamental measure in macroeconomics, representing the dollar value of all goods and services produced within a country's borders over a specific period. It is also interpreted as the total income earned by those contributing to production.
Nominal GDP: Measures output using current prices.
Real GDP: Adjusts GDP for inflation, providing a more accurate reflection of economic growth.
Real GDP per Capita: Real GDP divided by the population, indicating average income per person.
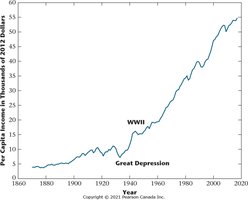
Per Capita Real GDP in Canada
Per capita real GDP is a key indicator of living standards. Historical data for Canada shows significant events such as the Great Depression (a sharp decline in income) and World War II (a substantial increase in output).
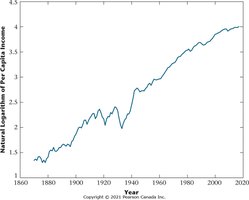
Natural Logarithm of Per Capita Real GDP
Using the natural logarithm of per capita real GDP allows economists to analyze growth rates. The slope of the log graph approximates the growth rate, and for Canada, the growth rate has been relatively constant except during major disruptions.
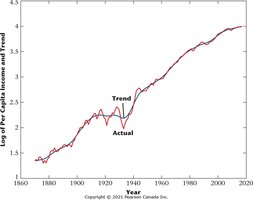
Separating Growth and Business Cycles
It is useful to distinguish between long-run growth and short-run business cycle fluctuations. The log of real per capita GDP can be compared to a smooth trend line, with deviations representing business cycles.
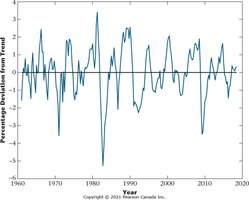
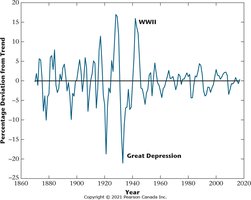
Business Cycle Volatility
Business cycles are measured by percentage deviations from the trend in per capita GDP. Since World War II, volatility has decreased, indicating more stable economic performance.
Macroeconomic Models
Purpose and Structure of Macroeconomic Models
Macroeconomic models are simplified representations of the economy used to analyze specific problems. While they may not capture every detail, their simplicity allows for clearer insights into economic mechanisms and policy effects.
Key Features: Focus on essential variables and relationships.
Applications: Used to study growth, cycles, inflation, unemployment, and policy impacts.
Recent and Current Macroeconomic Events
Key Macroeconomic Indicators
Several indicators are crucial for understanding the current state and trends in the economy:
Productivity Growth: Measures output per worker, a driver of long-term growth.
Government Spending and Surplus: Reflects fiscal policy and its impact on the economy.
Unemployment: Indicates labor market health.
Inflation: Shows changes in the price level.
Interest Rates: Affect borrowing, investment, and monetary policy.
Trade and Current Account Surplus: Measures international economic activity.
Business Cycles: Tracks expansions and recessions.
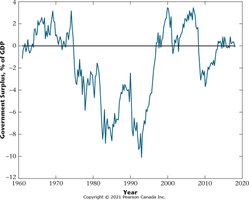
Government Surplus Trends
The government surplus (or deficit) as a percentage of GDP fluctuates with economic conditions and fiscal policy. Canada experienced deficits in the mid-1970s, surpluses in the late 1990s, and a deficit during the 2008–2009 recession.
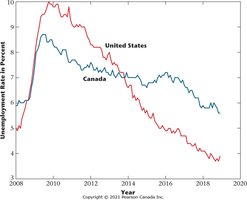
Unemployment Rates in Canada and the United States
Unemployment rates rose sharply during the 2008 recession, with the United States experiencing a higher peak and a faster recovery compared to Canada.
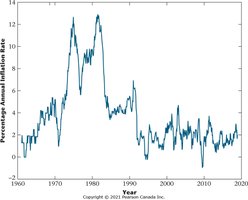
Inflation in Canada
Inflation rates in Canada were high during the 1970s but were reduced through monetary policy, particularly after the Bank of Canada adopted inflation targeting in 1991.
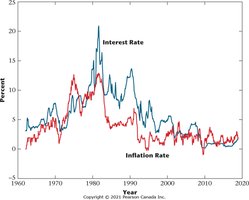
Nominal Interest Rate and Inflation Rate
Macroeconomic theory suggests a positive relationship between nominal interest rates and inflation rates. The three-month Treasury bill rate in Canada generally tracks the inflation rate.
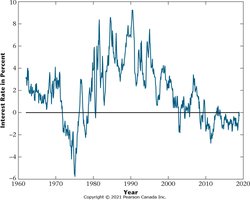
Real Interest Rate
The real interest rate is calculated as the nominal interest rate minus the actual rate of inflation. Monetary policy can influence real rates, as seen in the high real rates of the 1980s and the accommodative policy after the last recession.
Formula:
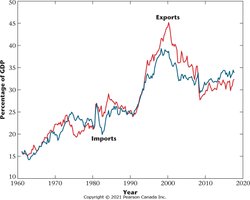
Exports and Imports as Percentages of GDP
Canada's exports and imports have increased over time, reflecting greater integration into world trade. Both exports and imports declined from 2000 to 2018.
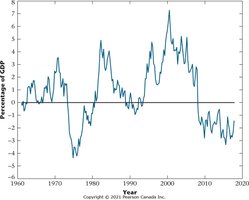
Net Exports and Current Account Surplus
Net exports (exports minus imports) are plotted as a percentage of GDP. Canada ran trade deficits for much of the period, but experienced surpluses in the late 1990s and a deficit during the 2008–2009 recession.
Business Cycles in Canada
Business cycles are illustrated by percentage deviations from the trend in real GDP. Severe recessions are marked by large negative deviations, notably in 1981–1982, 1991–1992, and 2008–2009.