 Back
BackMacroeconomics Exam 1 Review: Key Concepts and Practice Problems
Study Guide - Smart Notes
 Tailored notes based on your materials, expanded with key definitions, examples, and context.
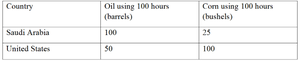
Q1. What is Saudi Arabia’s opportunity cost of producing 1 barrel of oil? 1 bushel of corn?
Background
Topic: Opportunity Cost and Production Possibilities
This question tests your understanding of opportunity cost, which is a fundamental concept in economics. Opportunity cost refers to the value of the next best alternative that must be given up to obtain something else. Here, you are asked to calculate the opportunity cost for Saudi Arabia when it chooses to produce oil or corn, based on its production possibilities.
Key Terms and Formulas
Opportunity Cost: The amount of one good that must be given up to produce an additional unit of another good.
Production Possibilities: The maximum output combinations of two goods that can be produced with available resources.
To calculate the opportunity cost of producing one unit of a good, use the formula:
Step-by-Step Guidance
Identify the maximum outputs for Saudi Arabia: 100 barrels of oil or 25 bushels of corn (from the table below).
To find the opportunity cost of 1 barrel of oil, divide the maximum corn output by the maximum oil output: .
To find the opportunity cost of 1 bushel of corn, divide the maximum oil output by the maximum corn output: .
Interpret what these ratios mean: Each ratio tells you how much of one good must be given up to produce one more unit of the other good.
Try solving on your own before revealing the answer!
Q2. What is the United States’ opportunity cost of producing 1 barrel of oil? 1 bushel of corn?
Background
Topic: Opportunity Cost and Production Possibilities
This question is similar to the previous one, but now you are asked to calculate the opportunity cost for the United States using its production possibilities.
Key Terms and Formulas
Opportunity Cost: The value of the next best alternative forgone.
Use the same formula as before:
Step-by-Step Guidance
Identify the maximum outputs for the United States: 50 barrels of oil or 100 bushels of corn.
Calculate the opportunity cost of 1 barrel of oil: .
Calculate the opportunity cost of 1 bushel of corn: .
Interpret these ratios to understand what must be given up to produce each good.
Try solving on your own before revealing the answer!
Q3. Who has the absolute advantage in oil production? In corn production?
Background
Topic: Absolute Advantage
This question tests your understanding of absolute advantage, which refers to the ability of a producer to produce more of a good using the same amount of resources compared to another producer.
Key Terms and Formulas
Absolute Advantage: The ability to produce more of a good with the same resources.
Step-by-Step Guidance
Compare the maximum outputs for oil: Saudi Arabia (100 barrels) vs. United States (50 barrels).
Compare the maximum outputs for corn: Saudi Arabia (25 bushels) vs. United States (100 bushels).
The country with the higher maximum output for each good has the absolute advantage in that good.
Try solving on your own before revealing the answer!
Q4. Who has the comparative advantage in oil production? In corn production?
Background
Topic: Comparative Advantage
This question tests your understanding of comparative advantage, which is the ability to produce a good at a lower opportunity cost than another producer.
Key Terms and Formulas
Comparative Advantage: The ability to produce a good at a lower opportunity cost.
Step-by-Step Guidance
Use your previously calculated opportunity costs for both countries and both goods.
For oil: The country with the lower opportunity cost of producing oil has the comparative advantage in oil.
For corn: The country with the lower opportunity cost of producing corn has the comparative advantage in corn.
Try solving on your own before revealing the answer!
Q5. Graph the Production Possibilities Frontier (PPF) for both countries using the data above.
Background
Topic: Production Possibilities Frontier (PPF)
This question tests your ability to graphically represent the trade-offs between two goods that a country can produce, given its resources. The PPF shows all possible combinations of two goods that can be produced using all available resources efficiently.
Key Terms and Formulas
PPF: A curve showing the maximum attainable combinations of two products that may be produced with available resources and current technology.
Step-by-Step Guidance
For Saudi Arabia, plot the endpoints: (100 barrels of oil, 0 corn) and (0 oil, 25 bushels of corn).
For the United States, plot the endpoints: (50 barrels of oil, 0 corn) and (0 oil, 100 bushels of corn).
Draw straight lines connecting the endpoints for each country to represent their PPFs.
Label each axis and each country's PPF clearly.
Try sketching the graphs before checking the answer!
