 Back
BackMacroeconomics: Foundations and Models – Chapter 1 Study Notes
Study Guide - Smart Notes
 Tailored notes based on your materials, expanded with key definitions, examples, and context.
Economics: Foundations and Models
Three Key Economic Ideas
Economics is the study of how people make choices to attain their goals, given scarce resources. Three foundational ideas guide economic analysis:
People are rational: Individuals use all available information to achieve their objectives, weighing costs and benefits before making decisions.
People respond to economic incentives: Changes in incentives alter behavior, as seen in policy impacts or market changes.
Optimal decisions are made at the margin: Most choices involve incremental adjustments, analyzed through marginal cost and marginal benefit.
· Some decisions are “all or nothing”
· Economists use the word marginal to mean “extra” or “additional”
· Economists reason that the optimal decision is to continue any activity up to the point where MB = MC
· In a market system, firms determine how goods and services will be produced
Example: Apple sets iPhone prices to maximize profit, not randomly. Marginal analysis helps decide whether to study an extra hour or watch TV.
The Economic Problem That Every Society Must Solve
Scarcity means unlimited wants exceed limited resources, leading to trade-offs. Every society must answer:
What goods and services will be produced? Choices involve opportunity cost—the value of the next best alternative forgone.
How will goods and services be produced? Firms select production methods based on costs and available technology.
Who will receive the goods and services produced? Distribution often depends on income, but government policies can alter this.
Trade-off: Increasing production of one good requires reducing another due to resource limitations.
Centrally Planned Economies Versus Market Economies
Economic systems differ in how resources are allocated:
Centrally planned economy: Government decides allocation.
Market economy: Households and firms interact in markets to allocate resources.
Mixed economy: Most decisions are market-driven, but government plays a significant role.
The U.S. is best described as a mixed economy, with both market and government influences.
Efficiency and Equity in Market Economies
Market economies promote:
Productive efficiency: Goods/services produced at lowest cost.
Allocative efficiency: Production matches consumer preferences; marginal benefit equals marginal cost.
Voluntary exchange ensures both buyers and sellers benefit. However, markets may not always be fully efficient or equitable.
Equity: Refers to fair distribution of economic benefits. Governments often balance efficiency and equity through policies.
Economic Models
Economists use models—simplified representations of reality—to analyze issues. The process involves:
Deciding on assumptions
Formulating a testable hypothesis
Using data to test the hypothesis
Revising the model if necessary
Retaining the model for future analysis
Models rely on behavioral assumptions (e.g., consumers maximize well-being, firms maximize profit). Hypotheses are tested using statistical methods.
Positive and Normative Analysis
Economics distinguishes between:
Positive analysis: What is (objective, fact-based)
Normative analysis: What ought to be (subjective, value-based)
Most economic research is positive, but policy decisions often require normative judgments.
Microeconomics and Macroeconomics
Economics is divided into two main branches:
Microeconomics: Studies individual households, firms, and markets.
Macroeconomics: Studies the economy as a whole, including inflation, unemployment, and growth.
Economic Skills and Economics as a Career
Studying economics develops skills in analysis, problem-solving, and decision-making. Economists help businesses and governments make informed choices. Economics majors often have higher-than-average incomes, though causation versus correlation is debated.
A Preview of Important Economic Terms
Key terms in economics include:
Scarcity: Unlimited wants, limited resources
Opportunity cost: Value of the next best alternative
Technology: Processes used to produce goods/services
Capital: Manufactured goods used for production
Appendix: Using Graphs and Formulas
Graphs and formulas are essential tools for economic analysis, helping visualize relationships and calculate changes.
Bar Graphs and Pie Charts
Bar graphs show data using the height of bars; pie charts represent data as slices of a circle.

Time-Series Graphs
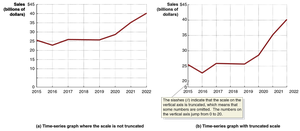
Time-series graphs display data over time, revealing trends and fluctuations. Truncated scales can exaggerate or minimize apparent changes.
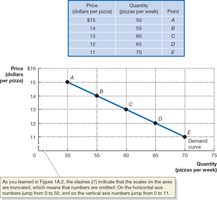
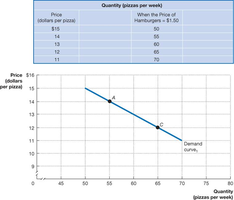
Plotting Price and Quantity Points
Graphs can illustrate the relationship between price and quantity, such as a demand curve for pizza.
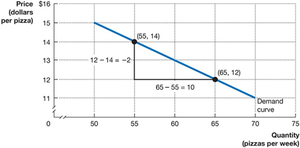
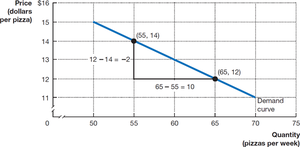
Calculating the Slope of a Line
The slope measures the change in the y-variable divided by the change in the x-variable. For a straight line, slope is constant.
Formula:
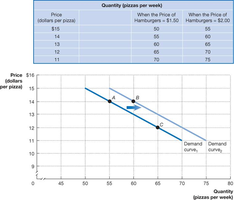
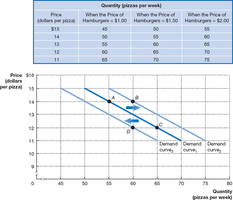
Showing Three Variables on a Graph
Graphs can hold one variable constant while showing the relationship between two others, such as price, quantity, and the price of a related good.
Positive and Negative Relationships
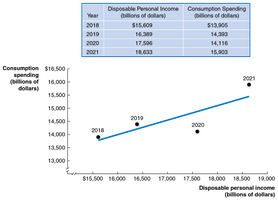
A positive relationship means both variables increase together; a negative relationship means one increases as the other decreases.
Determining Cause and Effect
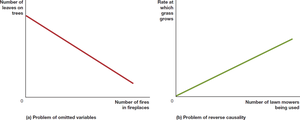
Graphs can suggest relationships but may not prove causality. Problems include omitted variables and reverse causality.
Linear and Nonlinear Relationships
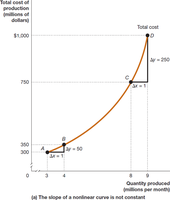
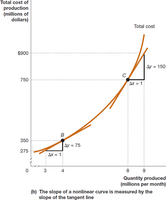
Most economic relationships are not perfectly linear. Nonlinear curves have varying slopes at different points.
Formula for Percentage Change
Percentage change measures the change in a variable from one period to the next, expressed as a percentage.
Formula:
Showing a Firm’s Total Revenue on a Graph
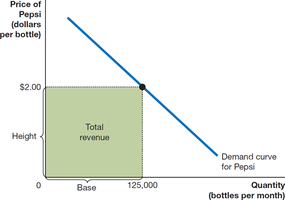
Total revenue is calculated as price times quantity, represented as the area of a rectangle on a graph.
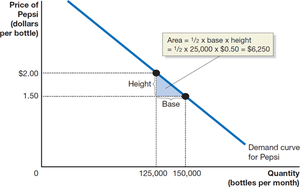
The Area of a Triangle
The area of a triangle is , useful for calculating surplus or other economic measures.
Summary of Using Formulas
Understand the economic concept represented by the formula.
Use the correct formula for the problem.
Check that the calculated value is economically reasonable.
