 Back
BackMacroeconomics Midterm Study Guidance: Fiscal Policy, Phillips Curve, Exchange Rates, and Balance of Payments
Study Guide - Smart Notes
 Tailored notes based on your materials, expanded with key definitions, examples, and context.
Q14. At which point are inflation expectations equal to the actual inflation rate?
Background
Topic: Phillips Curve and Inflation Expectations
This question tests your understanding of the relationship between the short-run and long-run Phillips curves, and how inflation expectations align with actual inflation rates.
Key Terms:
Short-run Phillips curve: Shows the trade-off between inflation and unemployment when inflation expectations are fixed.
Long-run Phillips curve: Vertical at the natural rate of unemployment, where inflation expectations equal actual inflation.
Inflation expectations: What workers and firms expect inflation to be, which affects wage and price setting.
Step-by-Step Guidance
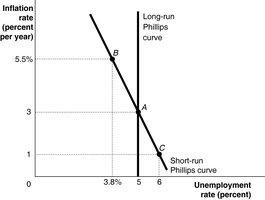
Examine the graph: Identify the intersection of the short-run and long-run Phillips curves.
Recall that the long-run Phillips curve is vertical at the natural rate of unemployment, where inflation expectations match actual inflation.
On the graph, locate the point where both curves meet. This is typically where the economy is at its natural rate of unemployment.
Compare the inflation rate at this intersection to the rates at other points on the short-run curve.
Try solving on your own before revealing the answer!
Final Answer: A
At point A, inflation expectations are equal to the actual inflation rate because it is where the short-run and long-run Phillips curves intersect.
This represents the natural rate of unemployment, and the inflation rate at this point is consistent with what workers and firms expect.
Q19. Europe suffers a recession. Assuming all else remains constant, this would be represented as a movement from:
Background
Topic: Exchange Rates and International Trade
This question tests your understanding of how changes in economic conditions abroad (such as a recession in Europe) affect the demand and supply for dollars and euros in the foreign exchange market.
Key Terms:
Exchange rate: The price of one currency in terms of another.
Demand for dollars: Influenced by foreign purchases of U.S. goods and services.
Supply of dollars: Influenced by U.S. purchases of foreign goods and services.
Recession: A period of declining economic activity, which typically reduces demand for imports.
Step-by-Step Guidance
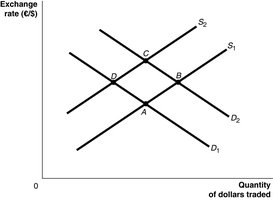
Consider what happens when Europe enters a recession: European consumers and businesses buy fewer U.S. goods, reducing demand for dollars.
On the exchange rate graph, a decrease in demand for dollars shifts the demand curve to the left (from D1 to D2).
Identify the points on the graph that correspond to the initial and new equilibrium after the demand curve shifts.
Compare the movement between these points to determine which answer choice best represents the effect of a European recession.
Try solving on your own before revealing the answer!
Final Answer: C (B to C)
When Europe suffers a recession, the demand for dollars falls, shifting the equilibrium from point B to point C on the graph.
This results in a lower exchange rate and quantity of dollars traded.
