 Back
BackMacroeconomics Practice Questions: Step-by-Step Guidance
Study Guide - Smart Notes
 Tailored notes based on your materials, expanded with key definitions, examples, and context.
Q1. What point represents a recession? What point represents an unattainable point without trade or economic growth? At which point would this country produce if there was a large demand for butter?
Background
Topic: Production Possibilities Frontier (PPF) and Economic Concepts
This question tests your understanding of the PPF, including concepts of recession, unattainable points, and shifts in production based on demand.
Key Terms:
Recession: When an economy operates inside its PPF, indicating underutilization of resources.
Unattainable Point: A point outside the PPF, not achievable without trade or growth.
PPF: Shows the maximum possible output combinations of two goods.
Step-by-Step Guidance
Recall that points inside the PPF represent inefficient use of resources (recession), while points outside are unattainable without growth or trade.
Identify which point on the diagram (if provided) is inside, on, or outside the PPF.
Consider how increased demand for butter would shift production along the PPF toward more butter and less of the other good.
Try solving on your own before revealing the answer!
Q2. What would a firm do to increase the quantity of goods demanded?
Background
Topic: Law of Demand
This question tests your understanding of how firms can influence the quantity demanded of their goods.
Key Terms:
Quantity Demanded: The amount of a good consumers are willing to buy at a given price.
Law of Demand: As price decreases, quantity demanded increases.
Step-by-Step Guidance
Recall the law of demand: lowering price increases quantity demanded.
Consider other factors that could shift the demand curve, such as advertising or improving product quality.
Focus on actions that move along the demand curve versus those that shift the curve.
Try solving on your own before revealing the answer!
Q3. Which of the following are included in a country's calculation of GDP?
Background
Topic: Gross Domestic Product (GDP)
This question tests your ability to distinguish between what counts in GDP and what does not.
Key Terms:
GDP: The total market value of all final goods and services produced within a country in a given period.
Final Goods: Goods sold to the end user, not for further processing.
Intermediate Goods: Goods used in the production of final goods, not counted separately in GDP.
Step-by-Step Guidance
Review each item and determine if it is a final good or service produced within the country.
Exclude non-market activities (e.g., unpaid work) and used goods (e.g., resale of lawn mowers).
Include only new, final goods and services produced domestically.
Try solving on your own before revealing the answer!
Q4. If a country had a real GDP of 51 billion in year 1, and 55 billion in year 2, what was the growth rate of real GDP from Y1 to Y2?
Background
Topic: Economic Growth Rate Calculation
This question tests your ability to calculate the growth rate of real GDP between two years.
Key formula:
Step-by-Step Guidance
Identify the real GDP values for each year: billion, billion.
Subtract the earlier year's GDP from the later year's GDP.
Divide the difference by the earlier year's GDP.
Multiply the result by 100 to get the percentage growth rate.
Try solving on your own before revealing the answer!
Q5. Population = 100 million; Unemployed = 8 million; Employed = 65 million. What is the labor force? What is the labor force participation rate? What is the unemployment rate?
Background
Topic: Labor Market Statistics
This question tests your ability to calculate key labor market indicators.
Key formulas:
Labor Force = Employed + Unemployed
Labor Force Participation Rate =
Unemployment Rate =
Step-by-Step Guidance
Add employed and unemployed to find the labor force.
Divide the labor force by the total population and multiply by 100 to find the participation rate.
Divide the number of unemployed by the labor force and multiply by 100 to find the unemployment rate.
Try solving on your own before revealing the answer!
Q6. When a wage or transfer payment is indexed to inflation, what is that called?
Background
Topic: Inflation Indexing
This question tests your knowledge of terminology related to inflation adjustments.
Key Terms:
Indexing: Adjusting payments to maintain purchasing power as prices change.
Cost-of-Living Adjustment (COLA): A common term for this practice.
Step-by-Step Guidance
Recall the term used when payments are adjusted for inflation.
Think about examples like Social Security or union wages.
Try solving on your own before revealing the answer!
Q7. If the price index moves from 110 to 113, what is the rate of inflation?
Background
Topic: Inflation Rate Calculation
This question tests your ability to calculate the rate of inflation using a price index.
Key formula:
Step-by-Step Guidance
Identify the price index values for each year: 110 and 113.
Subtract the earlier year's index from the later year's index.
Divide the difference by the earlier year's index.
Multiply by 100 to get the percentage rate.
Try solving on your own before revealing the answer!
Q8. Does inflation hurt borrowers or lenders? Deflation?
Background
Topic: Effects of Inflation and Deflation
This question tests your understanding of how inflation and deflation impact borrowers and lenders.
Key Terms:
Inflation: General rise in prices, eroding purchasing power.
Deflation: General fall in prices, increasing real value of money.
Step-by-Step Guidance
Consider how inflation affects the real value of money owed and money lent.
Think about who benefits and who loses when prices rise or fall.
Try solving on your own before revealing the answer!
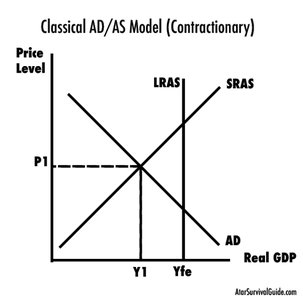
Q9. In the above model, does the short run equilibrium indicate that the economy is in a recession or experiencing inflation? What line on this model is “potential GDP?”
Background
Topic: Aggregate Demand/Aggregate Supply (AD/AS) Model
This question tests your ability to interpret the AD/AS model and identify economic conditions and potential GDP.
Key Terms:
Short Run Equilibrium: Where AD intersects SRAS.
Potential GDP: The level of output at full employment, shown by LRAS.
Step-by-Step Guidance
Examine the intersection of AD and SRAS relative to LRAS (Yfe) in the diagram.
If equilibrium output (Y1) is less than potential GDP (Yfe), the economy is in a recession.
Identify the vertical line labeled LRAS as representing potential GDP.
Try solving on your own before revealing the answer!
