 Back
BackMacroeconomics Review: Key Concepts from Micro to Aggregate Supply & Demand
Study Guide - Smart Notes
 Tailored notes based on your materials, expanded with key definitions, examples, and context.
From Microeconomics to Macroeconomics
Reconciling Micro and Macro
Economics studies the allocation of scarce resources. Microeconomics focuses on individual markets and choices, while macroeconomics examines the economy as a whole, including the connections between markets and aggregate outcomes.
Microeconomics: Studies demand and supply in single markets, aiming for efficient allocation and market clearing.
Macroeconomics: Studies aggregate outcomes such as real GDP, unemployment, and inflation, and considers economy-wide policies (fiscal, monetary, trade).
Key Insight: Individual optimization does not always lead to desirable aggregate outcomes.
Hands-Off vs. Hands-On Approaches
The speed at which markets self-adjust determines whether economists advocate for government intervention (Hands-On) or not (Hands-Off).
Hands-Off: Belief in quick self-adjustment, market failures are rare, associated with right-leaning politics.
Hands-On: Belief in slow self-adjustment, market failures are common, associated with left-leaning politics.
Fallacy of Composition: Micro outcomes do not always aggregate to macro outcomes.
GDP and Living Standards
Measuring GDP
Gross Domestic Product (GDP) is a key indicator of material living standards. To compare living standards over time, changes in price and population must be excluded.
Nominal GDP: Value of all final goods/services produced in a country at current prices.
Real GDP: Value of all final goods/services produced in a country at constant base-year prices.
Real GDP per Capita: Real GDP divided by population.
GDP Calculation Methods
Expenditure Approach: , where C = consumption, I = investment, G = government spending, X = exports, IM = imports.
Income Approach: Sums all incomes earned in production (wages, rent, profit).
Value Added Approach: Sums the value added at each stage of production.
Why subtract imports? Imports are subtracted because they are not produced domestically and should not be included in GDP.
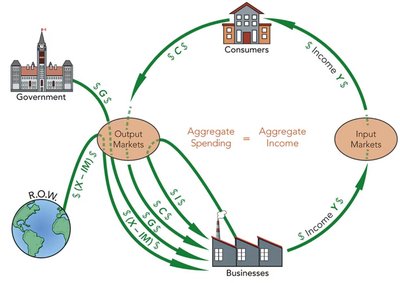
The Circular Flow and Injections/Leakages
The circular flow model illustrates how money moves through the economy, identifying injections (additions to spending) and leakages (withdrawals from spending).
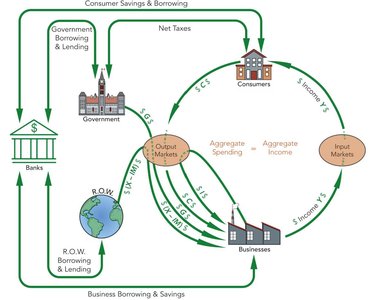
Injections: Investment, government spending, exports.
Leakages: Savings, taxes, imports.
Limitations of GDP as a Measure of Well-Being
Omits non-market production (e.g., household work).
Omits the underground economy.
Ignores environmental sustainability.
Ignores leisure and social factors.
Ignores political freedoms and social injustice.
Potential GDP, Economic Growth, and Business Cycles
Potential GDP
Potential GDP is the level of real GDP when all resources are fully employed. Actual GDP can be above (unsustainable) or below (underutilization) potential GDP.
Short-run goal: Achieve potential GDP per capita.
Long-run goal: Increase potential GDP per capita (economic growth).
Economic Growth
Economic growth is the expansion of the economy's capacity to produce goods and services (increase in potential GDP).
Occurs through increases in the quantity or quality of inputs (labour, capital, technology).
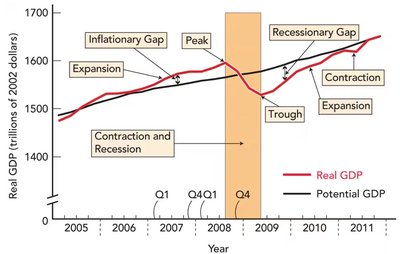
Business Cycles
Business cycles are fluctuations of real GDP around potential GDP, including periods of expansion, peak, contraction, and trough.
Economic shocks: Unexpected events affecting macroeconomic performance.
Internal shocks: Originate within the economy (e.g., changes in consumer confidence).
External shocks: Originate outside the economy (e.g., oil price shocks).
Positive shocks: Boost economic activity.
Negative shocks: Reduce economic activity (often trigger recessions).
Unemployment and Inflation
Measuring Unemployment
Employed: Working at a paid job (full- or part-time).
Unemployed: Not working but actively searching, on temporary layoff, or about to start a new job.
Labour Force: Employed + Unemployed.
Unemployment Rate:
Labour Force Participation Rate:
Types of Unemployment
Type | Cause | Healthy? | Needs Fixing? |
|---|---|---|---|
Frictional | Normal job search and matching | Yes | No |
Seasonal | Changes in demand by season | Yes | No |
Structural | Mismatch of skills or location | No | Yes |
Cyclical | Business cycle downturns | No | Yes |
Natural Rate of Unemployment: The rate associated with full employment (potential GDP).
Measuring Inflation
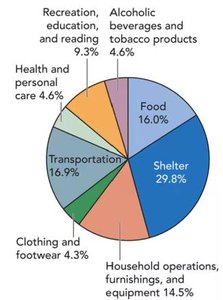
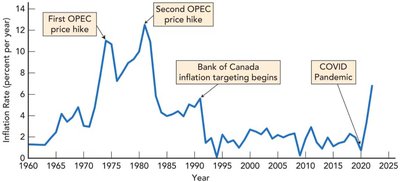
Inflation is a persistent rise in the average price level, measured by the Consumer Price Index (CPI).
CPI uses a fixed basket of goods (about 700 items) reflecting typical spending proportions.
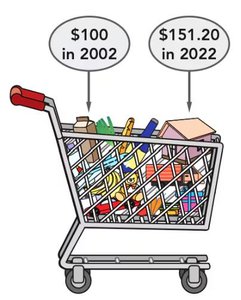
CPI is set to 100 in the base year; a CPI of 151 means prices rose 51% since the base year.
Inflation Rate:
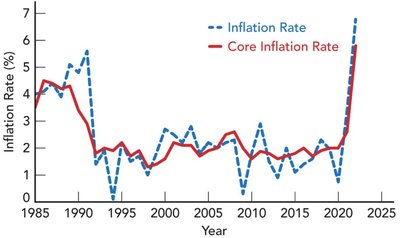
Total vs. Core Inflation
Total inflation includes all items; core inflation excludes volatile items (e.g., food, energy) for a clearer trend.
Inflation and Interest Rates
Nominal Interest Rate: The stated rate, not adjusted for inflation.
Real Interest Rate: Adjusted for inflation; reflects purchasing power.
Unexpected inflation benefits borrowers and hurts lenders.
Quantity Theory of Money (QTM)
QTM links the money supply to the price level:
Assumes velocity (V) and output (Q) are fixed, so increases in money supply (M) raise prices (P).
In reality, velocity can change, affecting the relationship between money supply and inflation.
The Phillips Curve
The Phillips Curve illustrates the short-run trade-off between unemployment and inflation.
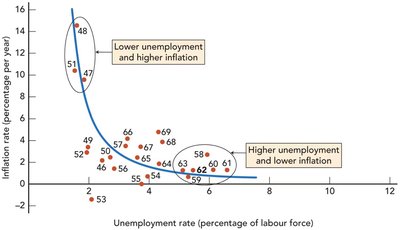
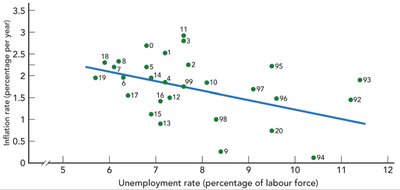
Lower unemployment is associated with higher inflation, and vice versa (short run).
Stagflation (high unemployment and high inflation) can occur due to supply shocks.
Types of Inflation
Type | Cause | Business Cycle Phase | Unemployment Impact | Inflation Impact | Phillips Curve |
|---|---|---|---|---|---|
Demand-Pull | Increase in Aggregate Demand | Expansion | Decrease | Increase | Movement along curve |
Cost-Push | Decrease in Aggregate Supply | Any phase (may cause contraction) | Increase | Increase | Curve shifts (stagflation) |
Aggregate Supply and Aggregate Demand
Aggregate Supply (AS) and Aggregate Demand (AD)
Macroeconomics uses the AS/AD model to analyze the entire economy, focusing on the overall price level and real GDP.
Aggregate Supply (AS): Total quantity of goods and services businesses plan to produce.
Aggregate Demand (AD): Total quantity of goods and services demanded by all players.
Long-Run Aggregate Supply (LAS)
LAS is vertical at potential GDP; in the long run, all prices and wages adjust.
Short-Run Aggregate Supply (SAS)
SAS is upward sloping; as the price level rises, quantity supplied increases due to sticky input prices.
Shifts in SAS are caused by changes in input prices, technology, or supply shocks.
Aggregate Demand (AD)
AD is downward sloping; as the price level rises, quantity demanded decreases due to wealth, interest rate, and exchange rate effects.
Shifts in AD are caused by changes in expectations, interest rates, government policy, foreign GDP, and exchange rates.
Macroeconomic Equilibrium and Shocks
Long-run equilibrium occurs where LAS, SAS, and AD intersect.
Shocks to AD or SAS can push the economy out of equilibrium, affecting price level and real GDP.
Simultaneous shocks to AD and SAS make the impact on one variable ambiguous and the other certain.
