 Back
Backexam 3 study guide
Study Guide - Smart Notes
 Tailored notes based on your materials, expanded with key definitions, examples, and context.
Aggregate Supply and Aggregate Demand
The Aggregate Supply (AS) Curve
The aggregate supply curve represents the total supply of goods and services produced within an economy at various price levels. It is a fundamental concept in macroeconomics, illustrating how output responds to changes in the price level.
Aggregate Supply (AS): The total supply of all goods and services in an economy.
AS Curve: Shows the relationship between aggregate output and the overall price level.
Short-Run AS Curve: Upward sloping due to wage rigidity; flatter at low output, steeper near capacity.
Vertical Portion: Represents maximum (capacity) output determined by existing resources.
Cost Shock/Supply Shock: Changes in production costs (e.g., oil prices) shift the AS curve.
Example: A sudden increase in energy prices shifts the AS curve left, raising prices and reducing output.

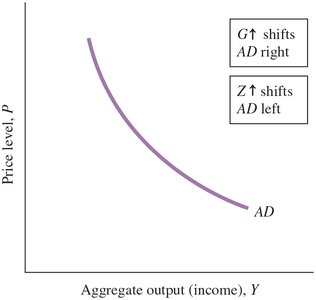
The Aggregate Demand (AD) Curve
The aggregate demand curve shows the total planned expenditure in the economy at different price levels. It is derived from the goods market and monetary policy interactions.
AD Curve: Downward sloping; higher price levels lead to higher interest rates, reducing investment and output.
Fed Rule: The central bank raises interest rates as output or inflation increases.
IS Curve: Negative relationship between output and interest rate; equilibrium in goods market for a given interest rate.
Example: An increase in government spending shifts the IS curve right, raising output.


Final Equilibrium
The intersection of the AS and AD curves determines equilibrium output and price level, reflecting decisions of households, firms, and government.
Equilibrium: Where AS and AD curves intersect; determines aggregate output and price level.
Other Reasons for Downward-Sloping AD Curve
Real Wealth Effect: Changes in real wealth due to price level changes affect consumption.
The Long-Run AS Curve and Potential GDP
In the long run, the AS curve is vertical at potential output, reflecting the economy's maximum sustainable output without inflation.
Potential Output/Potential GDP: The level of aggregate output sustainable in the long run without inflation.
Wage Adjustment: In the long run, wages adjust fully, returning output to potential GDP.

Policy Effects and Cost Shocks in the AS/AD Model
Fiscal Policy Effects
Fiscal policy, including changes in government spending and net taxes, affects aggregate demand and output.
Government Spending Multiplier: Larger than the tax multiplier; increases in G shift AD right.
Expansionary Policy: Works best when economy is below capacity; increases output with little price change.
Crowding Out: At capacity, expansionary policy mainly raises prices, not output.


Monetary Policy Effects
Fed Response: Changes in economic factors (Z) shift AD curve; strong preference for price stability makes AD curve flatter.
Zero Interest Rate Bound: When interest rates cannot go below zero, AD curve becomes vertical.
Shocks to the System
Cost Shocks: Lead to stagflation (higher unemployment and inflation); shift AS left.
Demand-Side Shocks: Lead to demand-pull inflation; shift AD right.
Expectations: Firms' expectations of future prices can shift AS curve.
The Labor Market in the Macroeconomy
Basic Concepts
Labor Force (LF): Employed plus unemployed.
Unemployment Rate: Percentage of labor force unemployed.
Types of Unemployment:
Frictional: Short-run job/skill matching problems.
Structural: Loss of jobs due to changes in economy structure.
Cyclical: Increase during recessions.
Classical View of the Labor Market
Wage Adjustment: Wages adjust to clear labor market; no unemployment.
Labor Demand and Supply Curves: Show equilibrium wage and employment.
Explaining Unemployment
Efficiency Wage Theory: Firms pay above market-clearing wage for higher productivity.
Imperfect Information: Firms may not know market-clearing wage.
Minimum Wage Laws: Set wage floor; can cause unemployment for low-productivity workers.
Sticky Wages and Cyclical Unemployment
Sticky Wages: Wages are slow to adjust downward, causing unemployment.
Social/Implicit Contracts: Firms avoid wage cuts due to unspoken agreements.
Explicit Contracts: Set wages for 1-3 years; COLAs adjust for inflation.
Unemployment Rate and Inflation: The Phillips Curve
Phillips Curve: Shows relationship between inflation rate and unemployment rate.
Short-Run: Negative relationship; trade-off between inflation and unemployment.
Long-Run: Vertical at natural rate of unemployment (NAIRU).
NAIRU Diagram
NAIRU: Nonaccelerating inflation rate of unemployment; at NAIRU, inflation rate is stable.
Financial Crises, Stabilization, and Deficits
Stock Market, Housing Market, and Financial Crises
Stock: Ownership certificate in a firm; returns include dividends and capital gains.
Stock Price Indices: Dow Jones, NASDAQ, S&P 500.
Household Wealth Effect: Rising asset values increase consumption and investment.
Financial Crisis: Asset price declines reduce wealth, causing macroeconomic problems.
Stabilization Policy and Time Lags
Stabilization Policy: Monetary and fiscal policy to smooth output and employment fluctuations.
Time Lags:
Recognition Lag: Time to recognize economic changes.
Implementation Lag: Time to enact policy.
Response Lag: Time for economy to respond.
Government Deficit Issues
Cyclical Deficits: Temporary, occur during recessions.
Structural Deficits: Persistent, occur at full employment; can have negative long-run effects.
Deficit Targeting: Laws to reduce deficits; can destabilize economy if implemented during downturns.
Term | Definition |
|---|---|
Automatic Stabilizer | Budget items that stabilize GDP automatically |
Automatic Destabilizer | Budget items that destabilize GDP automatically |

Household and Firm Behavior in the Macroeconomy
Households: Consumption and Labor Supply Decisions
Life-Cycle Theory of Consumption: Households base consumption on expected lifetime income.
Permanent Income: Average expected future income.
Labor Supply Decision: Influenced by wage rate, prices, wealth, nonlabor income, and interest rates.
Government Effects: Taxes and transfer payments affect consumption and labor supply.
Policy | Effect on Consumption | Effect on Labor Supply |
|---|---|---|
Increase Income Tax | Negative | Negative* |
Decrease Income Tax | Positive | Positive* |
Increase Transfer Payments | Positive | Negative |
Decrease Transfer Payments | Negative | Positive |
Firms: Investment and Employment Decisions
Expectations and Animal Spirits: Investor confidence affects investment.
Accelerator Effect: Investment increases with output growth.
Excess Labor/Capital: Surplus resources affect production decisions.
Inventory Investment: Change in stock of inventories; optimal policy balances lost sales and storage costs.
Productivity and the Business Cycle
Productivity: Output per worker hour; rises during expansions, falls during contractions.
Short-Run Relationship between Output and Unemployment
Okun's Law: Unemployment rate decreases about 1 percentage point for every 3% increase in real GDP.
Discouraged-Worker Effect: Unemployment rate declines when people stop looking for work.
Multiplier Effect
Multiplier: The ratio of change in output to change in spending; typically around 2.0.
Factors Reducing Multiplier: Automatic stabilizers, interest rate, price response, excess resources, inventories, expectations.
Economic Growth in Developing Economies
Life in Developing Nations: Population and Poverty
Global South: Developing nations in Asia, Africa, Latin America.
Disparities: Child mortality and literacy rates are much lower in developing countries.
Country | 1990 Child Mortality | 2013 Child Mortality | 1990 Literacy | 2013 Literacy |
|---|---|---|---|---|
Afghanistan | 179.1 | 97.3 | N/A | 47.0 |
United States | 11.2 | 6.9 | 100.0 | 100.0 |
Sources and Strategies for Economic Development
Capital Formation: Vicious circle of poverty; capital flight.
Human Resources: Brain drain; loss of talent to developed countries.
Infrastructure: Social overhead capital (roads, power, irrigation).
Role of Government: Enforce contracts, protect property rights, establish accounting principles.
Sectoral Shift: Moving labor from agriculture to industry increases productivity.
Country | Per-Capita GNI | Agriculture % | Industry % | Services % |
|---|---|---|---|---|
Tanzania | 460 | 30 | 23 | 47 |
United States | 47,890 | 1 | 21 | 78 |
Development Strategies
Import Substitution: Develop local industries to replace imports.
Export Promotion: Encourage exports.
Microfinance: Small loans to entrepreneurs, especially women; rapid repayment.
Development Interventions
Random Experiment: Randomly assign interventions to measure outcomes.
Natural Experiment: Use exogenous events to compare outcomes.
Education and Health: Key areas for improving development outcomes.
Key Terms and Concepts
Aggregate Supply (AS)
Aggregate Demand (AD)
Cost Shock/Supply Shock
Fed Rule
IS Curve
Potential Output/Potential GDP
Real Wealth Effect
Binding Situation
Cost-Push Inflation
Demand-Pull Inflation
Inflation Targeting
Stagflation
Zero Interest Rate Bound
Efficiency Wage Theory
Sticky Wages
Phillips Curve
NAIRU
Automatic Stabilizer/Destabilizer
Life-Cycle Theory of Consumption
Accelerator Effect
Okun's Law
Vicious Circle of Poverty
Capital Flight
Brain Drain
Import Substitution
Export Promotion
Microfinance
Random/Natural Experiment
Key Equations
(Aggregate output)
(where MPC is marginal propensity to consume)
