 Back
BackMacroeconomics Study Guide: GDP, Unemployment, Inflation, and Economic Growth
Study Guide - Smart Notes
 Tailored notes based on your materials, expanded with key definitions, examples, and context.
Gross Domestic Product: Measuring Total Production and Income
Definition and Components of GDP
Gross Domestic Product (GDP) is the most widely used measure of overall economic activity in a country. It represents the market value of all final goods and services produced within a country during a specific period, typically one year.
Market Value: Goods and services are valued at their market prices to provide a common measurement unit.
Final Goods and Services: Only goods and services purchased by final users are counted to avoid double counting. Intermediate goods are excluded.
Produced in a Country: GDP includes production within a country's borders, regardless of ownership.
Time Period: Only new goods and services produced within the specified period are included.
GDP can be measured by either total production or total income, as every product sold generates income for someone.
Expenditure Approach to GDP
The Bureau of Economic Analysis (BEA) measures GDP using four major categories of expenditures:
Consumption (C): Spending by households on goods and services, excluding new houses.
Investment (I): Spending by firms on new factories, machinery, inventories, and by households on new houses.
Government Purchases (G): Spending by federal, state, and local governments on goods and services, excluding transfer payments.
Net Exports (NX): Exports minus imports.
The GDP formula is:
Value Added Approach
GDP can also be measured by summing the value added at each stage of production. Value added is the market value a firm adds to a product.
Shortcomings of GDP
Omitted Production: Household production and underground economy are not included.
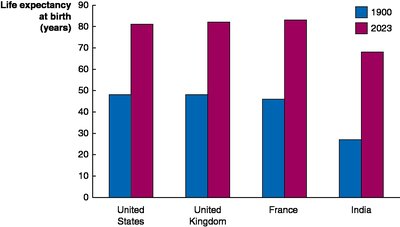
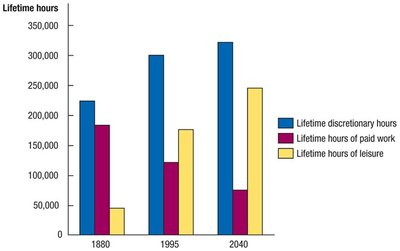
Well-Being: GDP per capita is often used to compare living standards, but it does not account for leisure, pollution, crime, or income distribution.
Real vs. Nominal GDP
Nominal GDP is measured at current-year prices, while real GDP is measured at base-year prices to account for inflation.
Chain-weighted prices are used to adjust for changing relative prices.
GDP Deflator
The GDP deflator measures the price level:
Other Measures
Gross National Product (GNP): Production by a nation's citizens, including overseas production.
National Income: GDP minus depreciation.
Personal Income: Income received by households, including transfer payments.
Disposable Personal Income: Personal income minus taxes.

Unemployment and Inflation
Measuring Unemployment
The unemployment rate is the percentage of the labor force that is unemployed. The labor force includes all employed and unemployed workers.
Labor Force Participation Rate: Percentage of working-age population in the labor force.
Employment-Population Ratio: Percentage of working-age population that is employed.
Unemployment is measured by the Current Population Survey and the Establishment Survey.
Types of Unemployment
Frictional Unemployment: Short-term unemployment from job search and seasonal factors.
Structural Unemployment: Persistent mismatch between workers' skills and job requirements.
Cyclical Unemployment: Unemployment caused by business cycle recessions.
The natural rate of unemployment consists of frictional and structural unemployment.
Explaining Unemployment
Government Policies: Unemployment insurance and minimum wage laws can affect unemployment rates.
Labor Unions: Bargain for higher wages and better conditions, but have limited impact on overall unemployment.
Efficiency Wages: Firms pay above-market wages to increase productivity, contributing to unemployment.
Measuring Inflation
Inflation is the percentage increase in the price level from one year to the next. Common measures include:
Consumer Price Index (CPI): Average prices paid by a typical urban family for goods and services.
Producer Price Index (PPI): Average prices received by producers at all stages of production.
Inflation rate formula:
Nominal vs. Real Interest Rates
Nominal interest rate is the stated rate on a loan. Real interest rate adjusts for inflation:
Costs of Inflation
Anticipated Inflation: Causes redistribution of income, menu costs, and taxes on nominal returns.
Unanticipated Inflation: Makes borrowing and lending risky, affecting real interest rates.
Economic Growth, the Financial System, and Business Cycles
Long-Run Economic Growth
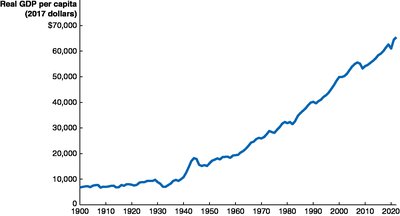
Long-run economic growth is the process by which rising productivity increases the average standard of living, measured by real GDP per capita.
Labor Productivity: Quantity of goods and services produced by one worker or one hour of work.
Factors Affecting Productivity: Increases in capital per hour worked, technological change, and secure property rights.

Calculating Growth Rates
Growth rate of an economic variable is the percentage change from one year to the next:
The Rule of 70 estimates the number of years to double:
Potential GDP
Potential GDP is the level of real GDP attained when all firms are operating at capacity. It rises with labor force expansion, capital stock growth, and new technologies.
Saving, Investment, and the Financial System
The financial system facilitates long-run economic growth by channeling funds from savers to borrowers.
Financial Markets: Where financial securities like stocks and bonds are bought and sold.
Financial Intermediaries: Firms like banks and insurance companies that borrow from savers and lend to borrowers.
Services Provided: Risk sharing, liquidity, and information aggregation.
Macroeconomics of Savings and Investment
In a closed economy:
Savings equals investment:

Market for Loanable Funds
The market for loanable funds models the interaction of borrowers and lenders, determining the equilibrium interest rate and quantity of funds exchanged.


Business Cycle
The business cycle consists of alternating periods of economic expansion and recession. Real GDP per capita rises over time but not consistently every year.
Expansion: Periods of rising GDP and employment.
Recession: Periods of falling GDP and employment.
Peaks and Troughs: Points where the economy changes phase.
Inflation tends to rise during expansions and fall during recessions. Unemployment rises during recessions and may continue to rise after recessions end.
Stabilization and the Great Moderation
Factors contributing to economic stability include the increasing importance of services, unemployment insurance, active government stabilization policies, and a stable financial system.
Tables and Data
Summary of Loanable Funds Model
An increase in... | Will shift the... | Causing... |
|---|---|---|
Government's budget deficit | Supply of loanable funds curve to the left | Real interest rate to increase and investment to decrease |
Desire of households to consume today | Supply of loanable funds curve to the left | Real interest rate to increase and investment to decrease |
Tax benefits for saving | Supply of loanable funds curve to the right | Real interest rate to decrease and investment to increase |
Expected future profits from new investments | Demand for loanable funds curve to the right | Real interest rate and investment to increase |
Corporate taxes | Demand for loanable funds curve to the left | Real interest rate and investment to decrease |
U.S. Business Cycle Since 1950
Peak | Trough | Length of Recession |
|---|---|---|
July 1953 | May 1954 | 10 months |
August 1957 | April 1958 | 8 months |
April 1960 | February 1961 | 10 months |
December 1969 | November 1970 | 11 months |
November 1973 | March 1975 | 16 months |
January 1980 | July 1980 | 6 months |
July 1981 | November 1982 | 16 months |
July 1990 | March 1991 | 8 months |
March 2001 | November 2001 | 8 months |
December 2007 | June 2009 | 18 months |
February 2020 | April 2020 | 2 months |
Underground Economy as Percentage of GDP
Country | Underground Economy (%) |
|---|---|
Bolivia | 63 |
Georgia | 62 |
Nigeria | 57 |
Russia | 40 |
Brazil | 37 |
Poland | 24 |
India | 24 |
China | 14 |
United Kingdom | 11 |
United States | 8 |
Switzerland | 6 |
Measures of Total Production and Income (2022)
Measure | Billions of Dollars |
|---|---|
GDP | 25,744 |
GNP | 25,926 |
National income | 21,678 |
Personal income | 21,841 |
Disposable personal income | 18,703 |
Additional info: Academic context and explanations have been expanded for clarity and completeness. Images included are directly relevant to the topics discussed and reinforce key concepts.
