 Back
BackMacroeconomics Study Guide: Principles, Trade, GDP, and Inflation
Study Guide - Smart Notes
 Tailored notes based on your materials, expanded with key definitions, examples, and context.
Principles of Macroeconomics
How People Make Decisions
Macroeconomics begins with understanding how individuals, firms, and governments make choices in the face of scarcity. These choices are guided by fundamental principles:
Tradeoffs: Every decision involves giving up one thing to obtain another due to limited resources.
Opportunity Cost: The true cost of any decision is the value of the next best alternative foregone.
Marginal Analysis: Rational people make decisions by comparing marginal benefits and marginal costs.
Incentives: Changes in costs or benefits motivate people to alter their behavior.
Trade: Specialization and exchange allow all parties to benefit and consume more than they could alone.
Market Organization: Markets efficiently allocate resources through decentralized decisions.
Government Intervention: Governments can improve market outcomes by enforcing property rights and correcting market failures.
Interdependence and Gains from Trade
Comparative Advantage and Specialization
Trade enables individuals and nations to specialize in goods where they have a comparative advantage, increasing overall welfare. Comparative advantage, not absolute advantage, is the foundation for mutually beneficial trade.
Absolute Advantage: Ability to produce more of a good with the same resources.
Comparative Advantage: Ability to produce a good at a lower opportunity cost.
Opportunity Cost: What must be given up to obtain something else.
Specialization: Focusing resources on the production of one or a few goods.
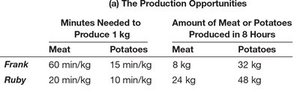
Example: Frank and Ruby's Production Opportunities
The table below shows the minutes needed and the amount produced by Frank and Ruby in 8 hours:
Meat | Potatoes | |
|---|---|---|
Frank (min/kg) | 60 | 15 |
Ruby (min/kg) | 20 | 10 |
Frank (kg in 8 hrs) | 8 | 32 |
Ruby (kg in 8 hrs) | 24 | 48 |
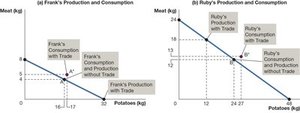
Gains from Trade: Summary Table
Meat | Potatoes | Meat | Potatoes | |
|---|---|---|---|---|
Frank | Ruby | |||
Without Trade | 4 kg | 16 kg | 12 kg | 24 kg |
With Trade: Production | 0 kg | 32 kg | 18 kg | 12 kg |
With Trade: Trade | gets 5 kg | gives 15 kg | gives 5 kg | gets 15 kg |
With Trade: Consumption | 5 kg | 17 kg | 13 kg | 27 kg |
Gains from Trade | +1 kg | +1 kg | +1 kg | +3 kg |
Measuring National Output and Income
Gross Domestic Product (GDP)
GDP is the market value of all final goods and services produced within a country in a given period. It is a key indicator of economic activity and living standards.
Market Value: Uses market prices to aggregate different products.
Final Goods: Only includes final goods to avoid double counting.
Produced: Only currently produced goods and services are counted.
Within a Country: Measures production within geographic boundaries.
Time Period: Usually measured annually or quarterly.
Components of GDP
GDP can be measured using the expenditure approach:
Consumption (C): Household spending on goods and services.
Investment (I): Spending on capital equipment, inventories, and structures.
Government Purchases (G): Spending by all levels of government.
Net Exports (NX): Exports minus imports.
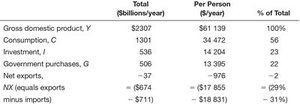
Example: Canadian GDP Components
Total ($ billions/year) | Per Person ($/year) | % of Total | |
|---|---|---|---|
Gross domestic product, Y | 2307 | 61,139 | 100% |
Consumption, C | 1301 | 34,472 | 56% |
Investment, I | 536 | 14,204 | 23% |
Government purchases, G | 506 | 13,905 | 22% |
Net exports, NX | -37 | -975 | -2% |
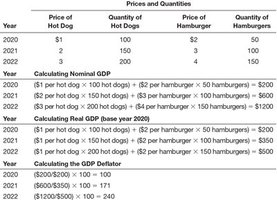
Nominal vs. Real GDP
Nominal GDP measures output using current prices, while Real GDP uses constant base-year prices to adjust for inflation.
Nominal GDP:
Real GDP:
GDP Deflator:
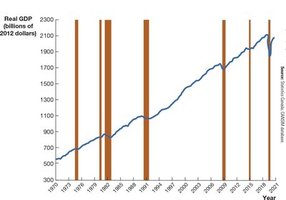
Real GDP Over Time
Tracking real GDP reveals long-term economic growth and business cycles. Periods of recession are marked by declines in real GDP.
GDP and Economic Well-Being
GDP per capita is often used to compare living standards, but it does not capture all aspects of welfare, such as leisure, non-market activities, environmental quality, and income distribution.
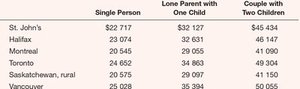
Example: Canada's Official Poverty Line
Single Person | Lone Parent with One Child | Couple with Two Children | |
|---|---|---|---|
St. John's | $22,717 | $32,127 | $45,434 |
Halifax | $23,074 | $32,631 | $46,147 |
Montreal | $20,545 | $29,655 | $41,090 |
Toronto | $24,852 | $34,863 | $49,304 |
Saskatchewan, rural | $20,575 | $29,097 | $41,150 |
Vancouver | $26,028 | $36,834 | $50,565 |
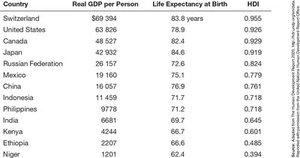
International Differences in GDP and Well-Being
Country | Real GDP per Person | Life Expectancy at Birth | HDI |
|---|---|---|---|
Switzerland | 89,394 | 83.8 years | 0.955 |
United States | 63,826 | 78.9 | 0.926 |
Canada | 48,527 | 82.4 | 0.929 |
Japan | 42,502 | 84.6 | 0.919 |
Russian Federation | 26,157 | 72.6 | 0.874 |
Mexico | 19,160 | 75.1 | 0.779 |
China | 16,057 | 76.9 | 0.761 |
Indonesia | 11,459 | 71.2 | 0.718 |
Philippines | 9,778 | 71.2 | 0.718 |
India | 6,681 | 63.7 | 0.645 |
Kenya | 4,204 | 66.7 | 0.601 |
Ethiopia | 2,207 | 66.6 | 0.485 |
Niger | 1,201 | 62.4 | 0.394 |
Measuring the Cost of Living and Inflation
Consumer Price Index (CPI)
The Consumer Price Index (CPI) measures the overall cost of goods and services bought by a typical consumer. It is a key indicator for tracking inflation and changes in the cost of living.
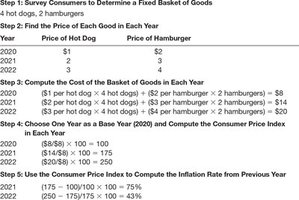
How the CPI Is Calculated
Determine the basket of goods and services.
Find the prices for each item in the basket.
Compute the basket’s total cost for each period.
Choose a base year and compute the index for each period.
Calculate the inflation rate as the percentage change in CPI.
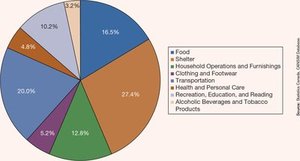
CPI Basket Composition
The CPI basket includes major categories such as food, shelter, transportation, and health care, weighted by their importance in consumer spending.
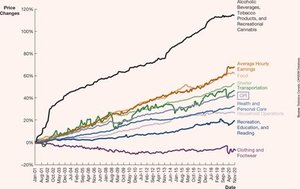
Price Changes Over Time
Different categories of goods and services experience varying rates of price change, affecting the overall inflation rate and consumer purchasing power.
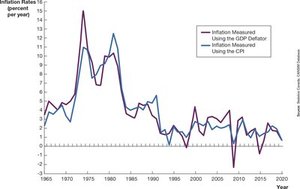
Comparing Inflation Measures: GDP Deflator vs. CPI
The GDP deflator and CPI both measure inflation but differ in scope and calculation:
GDP Deflator: Reflects prices of domestically produced goods and services.
CPI: Reflects prices of goods and services bought by consumers, including imports.
Production and Economic Growth
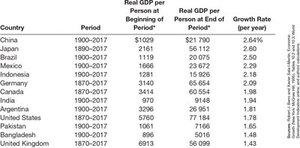
Global Growth Experiences
Growth rates and income levels vary across countries, influencing living standards and economic development.
Country | Period | Real GDP per Person at Beginning | Real GDP per Person at End | Growth Rate (per year) |
|---|---|---|---|---|
China | 1900–2017 | $1,029 | $21,790 | 2.64% |
Japan | 1880–2017 | 2,161 | 56,112 | 2.60% |
Brazil | 1900–2017 | 1,119 | 20,075 | 2.50% |
Mexico | 1900–2017 | 1,668 | 25,623 | 2.29% |
Indonesia | 1900–2017 | 1,281 | 15,926 | 2.20% |
Germany | 1870–2017 | 3,140 | 65,654 | 2.09% |
Canada | 1870–2017 | 3,414 | 56,117 | 2.08% |
India | 1900–2017 | 779 | 9,154 | 1.81% |
Argentina | 1900–2017 | 3,286 | 26,981 | 1.81% |
United States | 1870–2017 | 5,760 | 71,187 | 1.80% |
Pakistan | 1900–2017 | 1,061 | 7,166 | 1.65% |
Bangladesh | 1900–2017 | 1,087 | 5,016 | 1.43% |
United Kingdom | 1870–2017 | 6,913 | 56,099 | 1.43% |
Productivity: Its Role and Determinants
Productivity is the quantity of goods and services produced from each hour of a worker’s time. It is the key determinant of living standards and economic growth.
Physical Capital: Equipment and structures used in production.
Human Capital: Knowledge and skills acquired through education and training.
Natural Resources: Inputs provided by nature.
Technological Knowledge: Understanding of production methods.
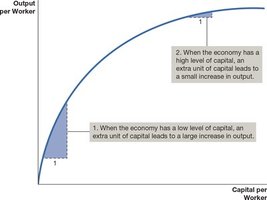
Diminishing Returns and the Catch-Up Effect
As capital increases, the benefit from additional capital decreases (diminishing returns). Poorer countries can grow faster due to the catch-up effect.
Key Terms and Concepts
Production Possibilities Frontier (PPF): Maximum attainable combinations of two products with available resources and technology.
Absolute Advantage: Producing more with the same resources.
Comparative Advantage: Producing at a lower opportunity cost.
Opportunity Cost: Value of the next best alternative foregone.
Consumer Price Index (CPI): Cost of a fixed basket of goods and services.
Inflation: Rate at which the general level of prices rises.
GDP Deflator: Price inflation for all domestically produced goods and services.
Indexation: Adjusting monetary values for inflation.
Nominal Interest Rate: Stated interest rate, not adjusted for inflation.
Real Interest Rate: Nominal rate minus inflation rate.
Additional info: Biases in CPI measurement can affect policy decisions and economic analysis. Comparing CPI and GDP deflator helps understand differences in inflation measurement. Indexation is crucial for maintaining purchasing power in long-term contracts.
