 Back
BackMacroeconomics Study Guide: Production Possibilities, Opportunity Cost, and Supply & Demand
Study Guide - Smart Notes
 Tailored notes based on your materials, expanded with key definitions, examples, and context.
Production Possibilities Frontier (PPF) and Opportunity Cost
Scarcity and Choice
The Production Possibilities Frontier (PPF) is a fundamental model in macroeconomics that illustrates the trade-offs and opportunity costs faced by an economy when allocating scarce resources between two goods. The PPF shows the maximum possible output combinations of two products given available resources and technology.
Scarcity: Resources are limited, so producing more of one good requires sacrificing some production of another.
Choice: The economy must decide how to allocate resources efficiently.
Opportunity Cost: The value of the next best alternative foregone when a choice is made.
Key Characteristics of the PPF
Points on the PPF: Represent efficient production combinations.
Points inside the PPF: Indicate inefficient use of resources.
Points outside the PPF: Are unattainable given current resources and technology.
Shape of the PPF: Usually bowed outward due to increasing opportunity costs.

Calculating Marginal Rate of Transformation (MRT) and Opportunity Cost
The Marginal Rate of Transformation (MRT) quantifies the opportunity cost of shifting resources from one good to another along the PPF. It is calculated as the ratio of the change in one good to the change in the other.
Formula:
Example: If moving from point A to B on the PPF increases T-shirts by 50 and decreases haircuts by 25, then .
Interpretation: The economy sacrifices 0.5 haircuts for each additional T-shirt produced.

Relationship Between Relative Prices and Opportunity Cost
Relative prices in a market economy are closely related to opportunity costs. The price ratio between two goods reflects the rate at which one good can be traded for another, which is analogous to the MRT on the PPF.
Relative Price: The price of one good in terms of another.
Opportunity Cost: The amount of one good that must be given up to produce more of another.
Productivity Change: If productivity increases for one good, the PPF shifts outward, reducing its opportunity cost.

Sources of Economic Growth
Economic growth is illustrated by an outward shift of the PPF, representing an increase in the economy's capacity to produce goods and services. This shift can result from several factors:
Increased Labor Productivity: Improvements in education, skills, or technology raise output per worker.
Technological Advancements: New technologies enable more efficient production.
Capital Accumulation: Investment in machinery, infrastructure, and tools increases productive capacity.
Expansion of Labor Force: More workers contribute to higher total output.
Improved Resource Allocation: Better use of resources enhances efficiency.

Supply and Demand Analysis
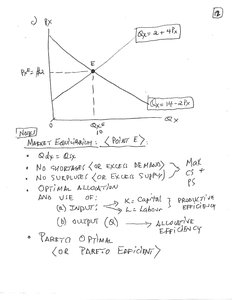
Market Equilibrium and Mathematical Analysis
Supply and demand are core concepts in macroeconomics, determining the equilibrium price and quantity in a market. The intersection of the supply and demand curves represents market equilibrium.
Demand Function:
Supply Function:
Equilibrium: Occurs where .
Solving for Equilibrium: Set the two equations equal and solve for price and quantity.
Graphical Analysis of Supply and Demand
Changes in demand or supply shift the respective curves, affecting equilibrium price and quantity. These shifts can be caused by changes in income, prices of related goods, consumer preferences, or production costs.
Normal Good: Demand increases as income rises.
Inferior Good: Demand decreases as income rises.
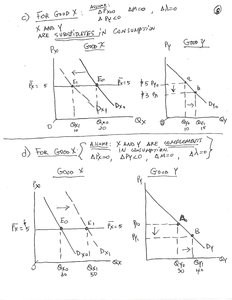
Substitutes: Increase in price of one good raises demand for another.
Complements: Increase in price of one good lowers demand for another.
Supply Shocks: Changes in input costs or technology shift supply.


Land and Labor Markets
Factor markets, such as land and labor, also follow supply and demand principles. The supply of land is typically fixed, while labor supply and demand can change based on wages and employment conditions.
Land Market: Supply is vertical; demand changes affect price.
Labor Market: Supply and demand for labor determine wage rates and employment levels.

Algebraic Solutions and Market Equilibrium
Solving for equilibrium price and quantity involves substituting values into supply and demand equations. This process is essential for understanding how markets clear and how changes in external factors affect outcomes.
Example: Given and , set to solve for and .
Graphical Representation: The intersection point on the graph shows equilibrium.

Effects of Changes in Related Goods
Changes in the price of related goods, such as substitutes or complements, alter the demand function and shift the demand curve. This leads to new equilibrium prices and quantities.
Example: If the price of a substitute increases, the demand for the original good rises, shifting the demand curve rightward.
New Demand Function: (after a change in the price of a related good).

Summary Table: Key Concepts
Concept | Definition | Example |
|---|---|---|
PPF | Shows maximum output combinations | Trade-off between T-shirts and haircuts |
Opportunity Cost | Value of next best alternative | Giving up haircuts to produce more T-shirts |
MRT | Rate of transformation between goods | |
Economic Growth | Outward shift of PPF | Increase in labor productivity |
Market Equilibrium | Where supply equals demand | Intersection of supply and demand curves |
Demand Shift | Change in demand due to external factors | Increase in income raises demand for normal goods |
Supply Shift | Change in supply due to cost or technology | Increase in wage reduces supply |
Additional info: Some explanations and context were expanded for clarity and completeness, including definitions and examples not explicitly shown in the original materials.
