 Back
Measurement of Macroeconomic Data: Unemployment and Inflation
Study Guide - Smart Notes
 Tailored notes based on your materials, expanded with key definitions, examples, and context.
Measurement of Macroeconomic Data: Unemployment and Inflation
Unemployment: Definitions and Measurement
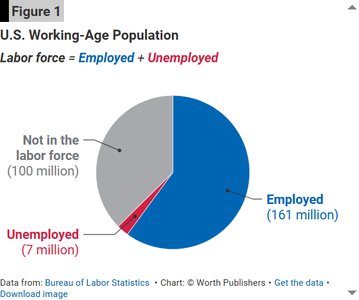
Unemployment is a key indicator of economic health, reflecting the share of the labor force that is not currently employed but actively seeking work. The U.S. Bureau of Labor Statistics (BLS) provides the official measures, dividing the adult population into several categories for analysis.
Unemployment Rate (UNR): The percentage of the labor force that is unemployed.
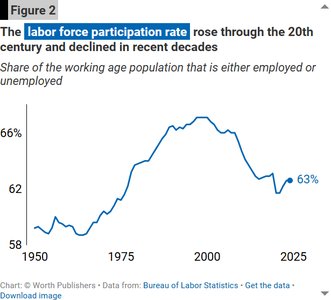
Labor Force Participation Rate (LFPR): The percentage of the working-age population that is either employed or unemployed.
Key Definitions:
Working-age population: Individuals aged 16 and older, not in the military or institutionalized.
Employed: Working-age people who worked at least one hour for pay in the past week, are self-employed, or are temporarily absent from a job.
Unemployed: Working-age people without jobs who are actively seeking work and able to accept a job if offered.
Not in the labor force: Working-age individuals who are neither employed nor unemployed (e.g., retirees, full-time students, discouraged workers).
Formulas:
Unemployment Rate:
Labor Force Participation Rate:

Labor Market Data and Demographics
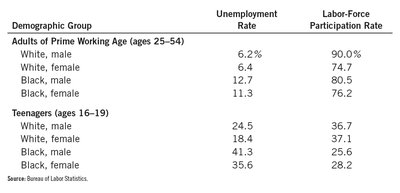
Labor market statistics are often broken down by demographic groups, such as age, gender, and race, to reveal disparities in unemployment and participation rates. For example, teenagers and minority groups often experience higher unemployment rates than prime-age adults.
Demographic Group | Unemployment Rate | Labor-Force Participation Rate |
|---|---|---|
White, male (25–54) | 6.2% | 90.0% |
White, female (25–54) | 6.4% | 74.7% |
Black, male (25–54) | 12.7% | 80.5% |
Black, female (25–54) | 11.3% | 76.2% |
White, male (16–19) | 24.5% | 36.7% |
White, female (16–19) | 18.4% | 37.1% |
Black, male (16–19) | 41.3% | 25.6% |
Black, female (16–19) | 35.6% | 28.2% |
Duration and Long-Term Unemployment
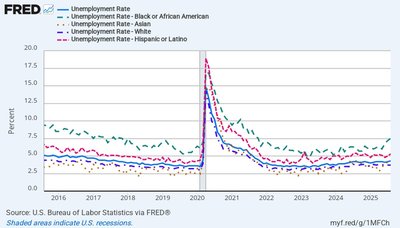
The duration of unemployment is an important indicator of labor market health. Long-term unemployment (27 weeks or more) can have severe economic and social consequences. Data is tracked both in terms of the number of people and as a percentage of total unemployment.



Labor Force Participation Rate (LFPR)
The LFPR measures the share of the working-age population that is either employed or actively seeking employment. This rate has changed over time due to demographic, social, and economic factors, including increased participation by women and declining participation by men.
LFPR Formula:



Types of Unemployment
Unemployment is classified into three main types, each with distinct causes and policy implications:
Frictional Unemployment: Short-term unemployment arising from the process of matching workers with jobs. It includes people transitioning between jobs or entering the labor force for the first time.
Cyclical Unemployment: Unemployment caused by downturns in the business cycle, such as recessions.
Structural Unemployment: Long-term unemployment resulting from mismatches between workers' skills and the requirements of available jobs, often due to technological change or shifts in the economy.
Special Labor Market Categories
Some groups are not counted in the official unemployment rate but are important for understanding labor market dynamics:
Discouraged Workers: Individuals who want to work but have stopped searching due to lack of opportunities. They are not counted as unemployed.
Marginally Attached Workers: People who have looked for work in the past year but not in the last four weeks.
Part-Time for Economic Reasons: Workers who would prefer full-time employment but can only find part-time work.
Inflation: Measurement and Implications
Inflation is the general increase in the price level of goods and services over time. Several indices are used to measure inflation:
Consumer Price Index (CPI): Measures the average change in prices paid by urban consumers for a fixed basket of goods and services.
GDP Deflator: Measures the price level of all domestically produced goods and services.
Producer Price Index (PPI): Measures the average change in selling prices received by domestic producers.
Personal Consumption Expenditures Price Index (PCE): A broader measure of inflation, used by the Federal Reserve.
Calculating Inflation Rate:
Inflation Rate:
Issues in Measuring Inflation
Several biases can cause the CPI to overstate the true cost of living:
Substitution Bias: Consumers may substitute cheaper goods for more expensive ones, but the CPI uses a fixed basket.
Quality Bias: Improvements in product quality may not be fully captured.
New Product Bias: The introduction of new products is not immediately reflected in the basket.
Outlet Bias: Changes in where consumers shop (e.g., discount stores) may not be captured.
Costs of Inflation
Inflation imposes several costs on the economy:
Menu Costs: The costs of changing prices.
Shoe-Leather Costs: The costs of reducing money holdings.
Unit of Account Costs: Inflation distorts price signals, making it harder to compare values over time.
Redistribution Effects: Unexpected inflation benefits borrowers and hurts lenders, as the real value of repayments changes.
Interest Rates and Inflation
Interest rates are closely linked to inflation. The nominal interest rate is the stated rate, while the real interest rate adjusts for inflation. The Fisher Equation describes this relationship:
Fisher Equation:
Where is the nominal interest rate, is the real interest rate, and is the inflation rate.
For risky borrowers, a risk premium is added:
Expanded Fisher Equation:
Where is the risk of default.
Summary Table: Key Labor Market and Inflation Concepts
Concept | Definition | Formula |
|---|---|---|
Unemployment Rate | Share of labor force unemployed | |
LFPR | Share of working-age population in labor force | |
Inflation Rate | Annual percentage change in price index | |
GDP Deflator | Price index for all goods/services produced | |
Fisher Equation | Nominal interest rate relationship |
Example: If the CPI in 2025 is 323.976 and in 2026 is 334.980, the inflation rate is:
Additional info: The notes above include expanded academic context and examples to ensure completeness and clarity for exam preparation.
