 Back
BackMeasuring a Nation’s Income: Gross Domestic Product (GDP) and Its Components
Study Guide - Smart Notes
 Tailored notes based on your materials, expanded with key definitions, examples, and context.
Business Cycles and the Health of the Economy
Introduction to Macroeconomics
Macroeconomics studies the economy as a whole, focusing on broad aggregates such as inflation, unemployment, and economic growth. Understanding the business cycle—alternating periods of economic expansion and recession—is crucial for analyzing the health of an economy.
Business cycle: Alternating periods of economic expansion and recession.
Expansion: Period when total production and employment are increasing.
Recession: Period when total production and employment are decreasing.
Economic growth: The ability of an economy to produce increasing quantities of goods and services over time.
Inflation rate: The percentage increase in the price level from one year to the next.
Measuring Total Production: Gross Domestic Product (GDP)
Definition and Key Concepts
Gross Domestic Product (GDP) is the market value of all final goods and services produced within a country in a given period of time. It is the most widely used measure of a nation’s total economic activity.
GDP measures both total income and total expenditure in the economy.
Every dollar spent by a buyer is a dollar of income for a seller.
GDP only includes goods and services with a market value, excluding non-market activities such as household work.
Only final goods are included to avoid double counting; intermediate goods are excluded unless they are sold directly to consumers.
GDP includes both tangible goods (e.g., cars, food) and intangible services (e.g., healthcare, education).
GDP measures current production within a country’s borders, regardless of the producer’s nationality.
GDP is typically measured annually or quarterly.
GDP Calculation Example
To calculate GDP, sum the market value of all final goods and services produced:
Identify final goods (e.g., energy drinks, pizzas, textbooks).
Exclude intermediate goods (e.g., paper used to make textbooks).
Multiply quantity produced by price per unit for each final good.
Add the values to obtain total GDP.
Example Calculation: If energy drinks, pizzas, and textbooks are the only final goods produced, and their values are $5000, $800, and $2000 respectively, then:
Components of GDP (Expenditure Approach)
Expenditure Categories
GDP can be divided into four main components:
Consumption (C): Total spending by households on goods and services, including durable goods (e.g., cars), nondurable goods (e.g., food), and services (e.g., healthcare).
Investment (I): Spending on capital equipment, structures, and inventories. Note: Investment does not include purchases of financial assets like stocks and bonds.
Government Purchases (G): Spending on goods and services by all levels of government. Excludes transfer payments (e.g., Social Security).
Net Exports (NX): Exports minus imports. Exports are goods and services sold abroad; imports are those purchased from abroad.
The GDP identity is:
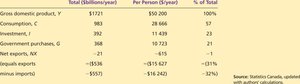
Table: GDP by Expenditure Components (Canada, 2011)
The following table summarizes the breakdown of GDP by expenditure components for the Canadian economy in 2011:
Component | Total (billion $/year) | Per Person ($/year) | % of Total |
|---|---|---|---|
Gross domestic product, Y | 1721 | 50,200 | 100% |
Consumption, C | 983 | 28,666 | 57% |
Investment, I | 392 | 11,423 | 23% |
Government purchases, G | 368 | 10,723 | 21% |
Net exports, NX | -21 | -615 | -1% |
Exports | 5531 | 16,423 | 32% |
Minus imports | -5551 | -16,423 | -33% |
GDP by Income Approach
Income Categories
GDP can also be measured by summing all incomes earned in the production of goods and services:
Wages and salaries
Corporation profits before tax
Government enterprise profits
Interest and investment income
Other business income
Indirect taxes
Capital consumption allowance
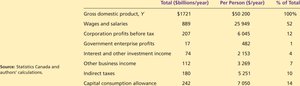
The following table summarizes the breakdown of GDP by income components for the Canadian economy in 2011:
Component | Total (billion $/year) | Per Person ($/year) | % of Total |
|---|---|---|---|
Gross domestic product, Y | 1721 | 50,200 | 100% |
Wages and salaries | 889 | 25,849 | 52% |
Corporation profits before tax | 207 | 6,045 | 12% |
Government enterprise profits | 17 | 482 | 1% |
Interest and other investment income | 74 | 2,153 | 4% |
Other business income | 112 | 3,269 | 7% |
Indirect taxes | 180 | 5,251 | 10% |
Capital consumption allowance | 242 | 7,699 | 14% |
Measuring GDP: Value-Added Method
Value Added
Value added is the market value a firm adds to a product. It is calculated as the difference between the sales price of a product and the cost of intermediate goods used to produce it. Summing the value added at each stage of production yields the total value of the final good, which is consistent with the expenditure and income approaches.
Real GDP versus Nominal GDP
Adjusting for Inflation
Inflation can distort economic variables like GDP. To account for this, economists distinguish between nominal and real GDP:
Nominal GDP: Values output using current prices; not corrected for inflation.
Real GDP: Values output using the prices of a base year; corrected for inflation.
Real GDP is calculated by multiplying current quantities by base-year prices. Over time, using a fixed base year can distort real GDP, so chain-weighted methods are used to minimize this distortion.
GDP Deflator: A measure of the overall price level, calculated as:
The GDP deflator can be used to calculate the inflation rate between two years.
GDP and Economic Well-Being
Limitations of GDP
While real GDP per capita is a key indicator of the average standard of living, GDP has several shortcomings as a measure of well-being:
Excludes household production and the underground economy.
Does not account for the value of leisure.
Ignores environmental quality and externalities.
Does not adjust for changes in crime or other social problems.
Does not measure the distribution of income (i.e., how the economic "pie" is divided).
Despite these limitations, higher GDP enables countries to afford better education, healthcare, and a cleaner environment. Many quality-of-life indicators are positively correlated with GDP.
GDP and Quality of Life Indicators
Countries with higher GDP per capita tend to have higher life expectancy, adult literacy rates, and happiness scores.
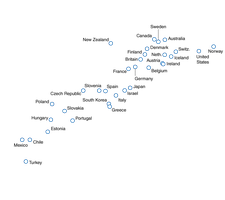
Additional info: The image above shows a positive correlation between real GDP per capita and the Better Life Index, illustrating that countries with higher GDP per person generally report higher levels of well-being.
