 Back
BackMeasuring National Output and Income: GDP and Its Applications
Study Guide - Smart Notes
 Tailored notes based on your materials, expanded with key definitions, examples, and context.
Measuring National Output and Income
Gross Domestic Product (GDP): Definition and Scope
Gross Domestic Product (GDP) is the market value of all final goods and services produced within a country during a specific period, typically a year. It serves as the primary indicator of a nation's economic activity and overall economic health.
Final goods and services: Only goods and services purchased by the final user are counted in GDP to avoid double counting. Intermediate goods, which are used as inputs in the production of other goods, are excluded because their value is already embodied in the final product.
Market transactions: GDP measures only market transactions where goods and services are bought and sold for money.
Geographical boundaries: GDP includes all production within a country's borders, regardless of the producer's nationality.
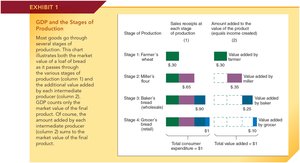
Exhibit 1 illustrates how GDP is calculated by summing the value added at each stage of production, ensuring only the final value is counted.
Simon Kuznets and the Development of GDP
Simon Kuznets was a pioneering economist who played a crucial role in developing the concept and measurement of GDP, which became a foundational tool for macroeconomic analysis.

GDP as a Measure of Output and Income
Two Approaches to Measuring GDP
GDP can be measured in two equivalent ways, reflecting its dual role as a measure of both output and income:
Expenditure Approach: Sums all expenditures on final goods and services produced within a country during a given period.
Resource Cost-Income Approach: Sums all incomes earned by resource suppliers and indirect costs associated with production.
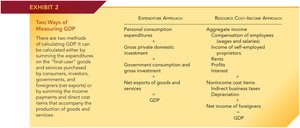
Exhibit 2 summarizes the components included in each approach.
Expenditure Approach Components
Personal consumption expenditures (C)
Gross private domestic investment (I)
Government consumption and gross investment (G)
Net exports (X - M): Exports minus imports
The formula for GDP using the expenditure approach is:
Resource Cost-Income Approach Components
Compensation of employees
Income of self-employed
Rents
Profits
Interest
Indirect business taxes
Depreciation
Net income of foreigners
Major Components of U.S. GDP (2016-2019)
The relative sizes of the major components of U.S. GDP fluctuate within a narrow range. The expenditure and resource cost-income approaches yield similar overall GDP figures but differ in their breakdown of components.
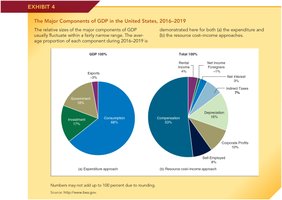
Exhibit 4 shows the average proportions of each component for both approaches.
Adjusting for Price Changes: Real vs. Nominal GDP
Nominal GDP vs. Real GDP
Nominal GDP measures the value of output using current prices, while Real GDP adjusts for changes in the price level, reflecting the true growth in output.
Price indexes such as the GDP deflator and Consumer Price Index (CPI) are used to adjust nominal GDP to real GDP.
GDP Deflator: A broad price index that reflects the prices of all goods and services included in GDP.
CPI: Measures the cost of a fixed basket of goods and services purchased by households.
Chained CPI and GDP Deflator: These indexes update the market basket more frequently and adjust for substitution, generally yielding slightly lower inflation estimates than the traditional CPI.
The formula for calculating real GDP is:
Changes in Prices and Real GDP (2012-2019)
Between 2012 and 2019, nominal GDP in the U.S. increased by 32.3%, but after adjusting for price changes, real GDP increased by only 17.8%.
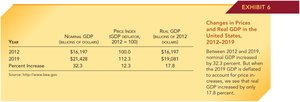
Exhibit 6 demonstrates the importance of adjusting for inflation when comparing GDP across time periods.
Shortcomings of GDP as a Measure
Limitations of GDP
While GDP is a valuable indicator, it has several shortcomings as a measure of economic well-being:
Excludes non-market activities (e.g., household labor, volunteer work)
Does not account for the value of leisure time
Ignores improvements in product quality and new technologies
Does not measure income distribution or environmental quality
Despite these limitations, GDP remains a crucial tool for comparing economic performance across countries and over time.
Per Capita GDP and Comparisons Over Time
Per Capita GDP
Per capita GDP is calculated by dividing a country's GDP by its population. It provides a measure of average income and is useful for comparing living standards across countries and time periods.
Formula:
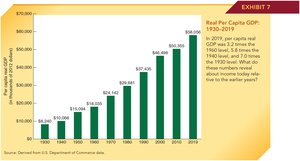
Exhibit 7 shows the growth of real per capita GDP in the U.S. from 1930 to 2019, highlighting significant increases in average income over time.
Interpretation: While per capita GDP has increased substantially, comparisons across time must consider changes in non-market production, leisure, work environment, and technology.
Cost of Living Differences Among Cities
Using Price Indexes for Regional Comparisons
Price indexes can also be used to compare the cost of living across different cities. The cost of purchasing a typical household bundle varies widely, affecting the real value of income in different locations.
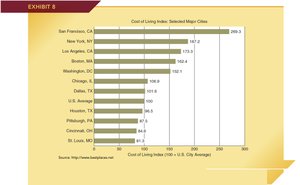
Exhibit 8 demonstrates that a given salary has different purchasing power depending on the city, due to variations in the cost of living.
Summary Table: Key GDP Concepts
Concept | Definition | Formula |
|---|---|---|
GDP | Market value of all final goods and services produced within a country in a given period | |
Nominal GDP | GDP measured at current prices | - |
Real GDP | GDP adjusted for changes in the price level | |
Per Capita GDP | GDP divided by population |
