 Back
BackMoney, Banking, and Monetary Policy: Study Notes for Macroeconomics
Study Guide - Smart Notes
 Tailored notes based on your materials, expanded with key definitions, examples, and context.
Money Creation and the Money Multiplier
Definition and Calculation of the Money Multiplier
The money multiplier measures the maximum potential increase in the money supply when new deposits enter the banking system. It is calculated as the reciprocal of the required reserve ratio:
Formula:
For example, with a 10% reserve ratio (), the multiplier is $10$.
If is deposited, the maximum increase in the money supply is .
Practice Using the Simple Money Multiplier
Banks create money by lending out excess reserves. The process depends on the reserve ratio:
When banks gain reserves, they make new loans, expanding the money supply.
When banks lose reserves, they reduce loans, contracting the money supply.
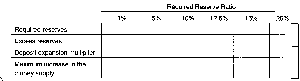
Key calculations for different reserve ratios:
The Money Multiplier in the Real World
In practice, the real-world money multiplier is often much lower than the simple multiplier due to:
Banks holding excess reserves or being unable to find credit-worthy borrowers.
Consumers keeping some currency outside the banking system.
During recessions, the multiplier can fall close to 1 (e.g., 2007-2009 recession).
The Federal Reserve System
History of Central Banking in the U.S.
Central banking in the U.S. evolved through several stages:
Colonial America used various currencies due to shortages of British pounds.
The First Bank of the U.S. (1791) and Second Bank of the U.S. (1816) had limited charters, leading to periodic banking panics.
The Federal Reserve was established in 1913 after the banking panic of 1907.
Structure of the Federal Reserve System
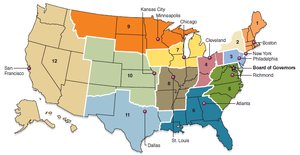
The Federal Reserve System consists of 12 districts, each serving regional banks, with central authority in Washington, D.C.:
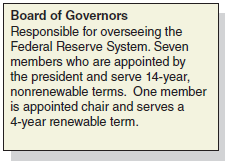
The Board of Governors oversees the system, with seven members appointed for 14-year terms and one chair serving a 4-year renewable term.
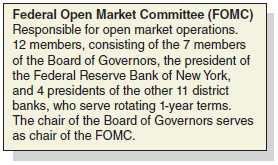
The Federal Open Market Committee (FOMC) conducts monetary policy, consisting of 12 members: 7 Board of Governors, the president of the New York Fed, and 4 rotating district bank presidents.
Monetary Policy
Definition and Goals
Monetary policy refers to the actions the Federal Reserve takes to manage the money supply and interest rates to achieve macroeconomic objectives:
Price stability
High employment
Economic growth
Stability of financial markets and institutions
The Role of the Federal Reserve
The Fed was originally created to prevent bank runs. Its responsibilities expanded after the Great Depression to include promoting maximum employment, stable prices, and moderate long-term interest rates.
The Quantity Theory of Money
Connecting Money and Prices: The Quantity Equation
The quantity theory of money links the money supply to the price level and real output. Irving Fisher formalized this relationship:
Quantity Equation:
M: Money supply
V: Velocity of money (average number of times each dollar is used in GDP transactions)
P: Price level
Y: Real output (GDP)
Growth Rates and Inflation
The equation can be expressed in terms of growth rates:
Or:
This leads to key predictions:
If money supply grows faster than real GDP, inflation occurs.
If money supply grows slower than real GDP, deflation occurs.
If money supply grows at the same rate as real GDP, price level is stable.
Monetarism
Monetarism, associated with Milton Friedman, advocates steady growth in the money supply to promote stability and economic growth. Friedman emphasized the role of wealth in consumption decisions.
Money Growth and Inflation
Empirical Evidence
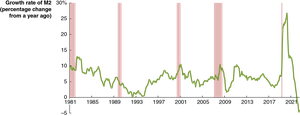
Historically, higher rates of money supply growth are associated with higher rates of inflation, both in the U.S. and internationally.


Hyperinflation
Definition and Causes
Hyperinflation refers to extremely high rates of inflation (over 100% per year). It often occurs when governments finance spending by forcing central banks to purchase government bonds, rapidly increasing the money supply.
Hyperinflation is usually accompanied by slow growth or severe recession.
Recent examples include Zimbabwe (2000s) and Venezuela (2019).
Historical Example: Germany in the 1920s
During the 1920s, Germany experienced hyperinflation as the government financed reparations and other expenses by increasing the money supply. The currency became worthless, and people used paper money for purposes such as lighting stoves.

The government ended hyperinflation by introducing a new currency, but the economic and social consequences were severe.
Quiz: Bank Runs vs. Bank Panics
Definitions
Bank run: Occurs when depositors withdraw funds from one bank due to fears of insolvency.
Bank panic: Involves many banks experiencing runs simultaneously, often leading to systemic crisis.
Summary Table: Money Multiplier Calculations
The following table summarizes the effect of different reserve ratios on required reserves, excess reserves, the deposit expansion multiplier, and the maximum increase in the money supply:
Reserve Ratio | Required Reserves | Excess Reserves | Deposit Expansion Multiplier | Maximum Increase in Money Supply |
|---|---|---|---|---|
1% | $10 | $990 | 100 | $100,000 |
5% | $50 | $950 | 20 | $20,000 |
10% | $100 | $900 | 10 | $10,000 |
15% | $150 | $850 | 6.67 | $6,670 |
20% | $200 | $800 | 5 | $5,000 |
30% | $300 | $700 | 3.33 | $3,330 |
Additional info: Table values inferred for completeness based on standard money multiplier calculations.
