 Back
BackMonitoring Jobs and Inflation: Employment, Unemployment, and Price Level in Macroeconomics
Study Guide - Smart Notes
 Tailored notes based on your materials, expanded with key definitions, examples, and context.
Monitoring Jobs and Inflation
Introduction
This chapter explores the measurement and significance of unemployment and inflation in the macroeconomy. It covers how labour market indicators are defined and calculated, the types and causes of unemployment, and the methods used to measure inflation and the price level.
Employment and Unemployment
Why Unemployment Is a Problem
Lost incomes and production: Unemployment leads to a reduction in total output and income. While unemployment benefits provide some support, they rarely fully compensate for lost wages, and not all unemployed individuals are eligible for benefits.
Lost human capital: Extended periods of unemployment can erode workers' skills and reduce their future employability, resulting in a permanent loss of human capital.
Labour Force Survey and Population Categories
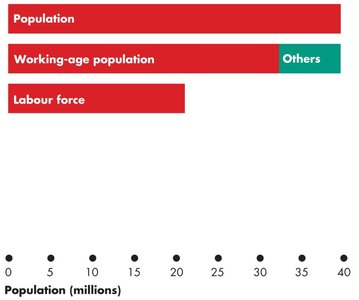
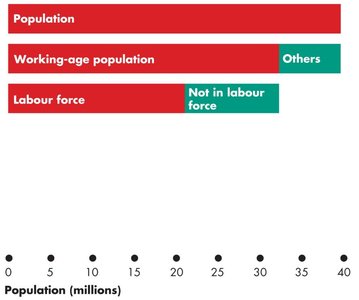
Statistics Canada conducts a monthly Labour Force Survey to classify the population into economic activity categories:
Working-age population: Individuals aged 15 years and older.
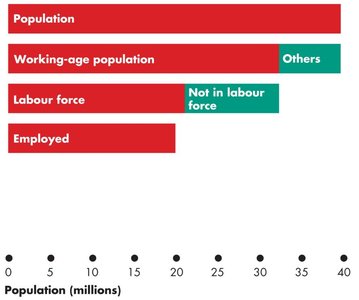
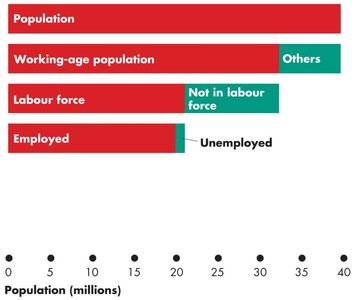
Labour force: The sum of employed and unemployed individuals.
Not in the labour force: Those not seeking work or not available for work.
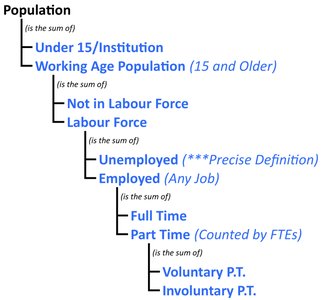
Labour Force Categories (July 2023 Example)
Population: 40.11 million
Working-age population: 32.53 million
Labour force: 21.33 million
Employment: 20.17 million
Unemployment: 1.16 million
Full-time employment: 16.56 million
Part-time employment: 3.61 million (3.33 million voluntary, 0.28 million involuntary)
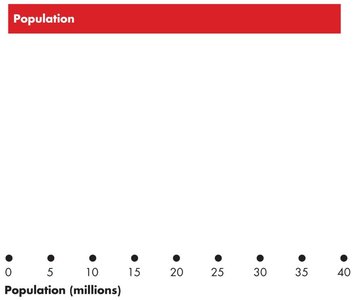
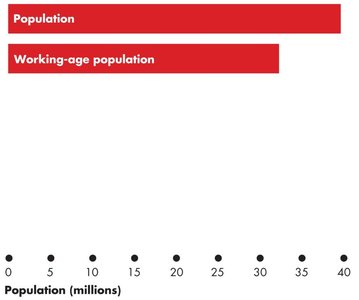
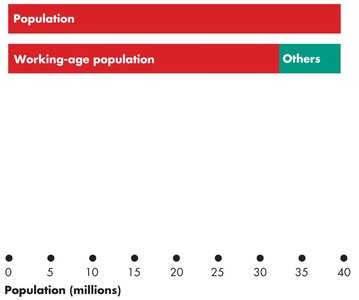
Labour Market Indicators
Unemployment rate: Percentage of the labour force that is unemployed.
Involuntary part-time rate: Percentage of the labour force working part-time but seeking full-time employment.
Labour force participation rate: Percentage of the working-age population in the labour force.
Employment rate: Percentage of the working-age population that is employed.
Calculating Labour Market Indicators
Unemployment Rate:
Involuntary Part-Time Rate:
Labour Force Participation Rate:
Employment Rate:
Trends in Unemployment and Participation
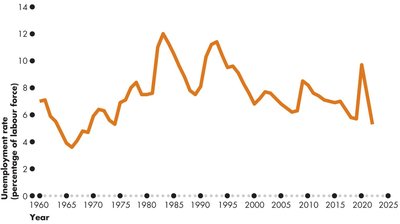
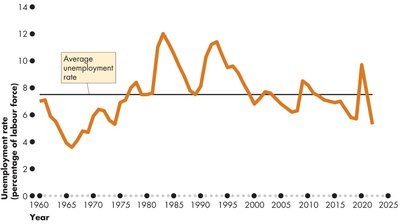
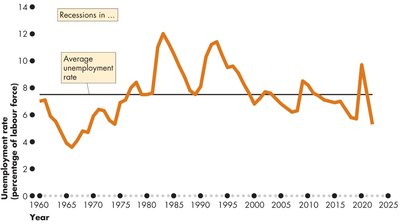
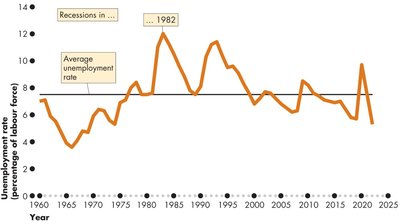
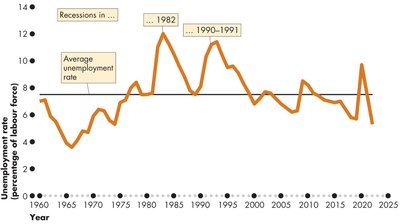
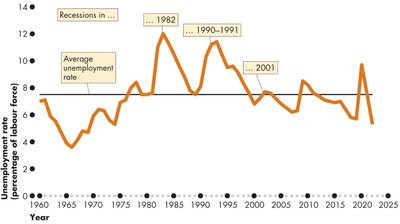
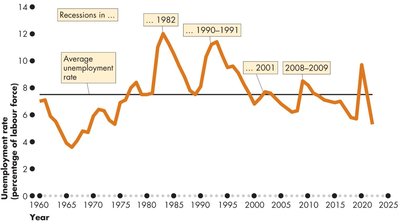
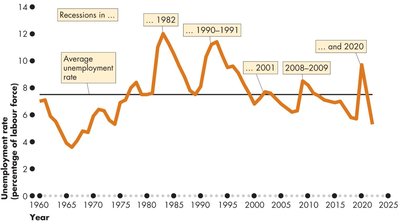
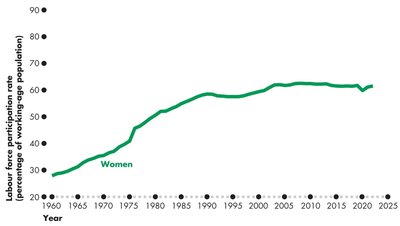
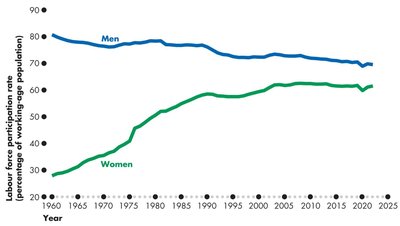
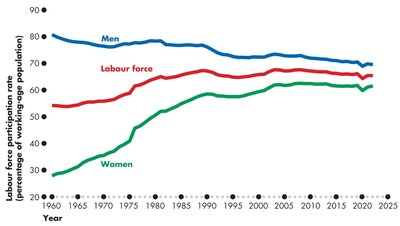
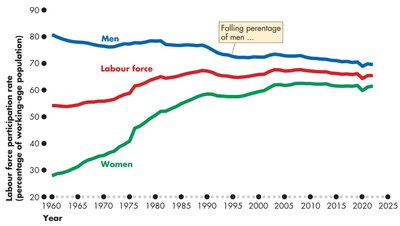
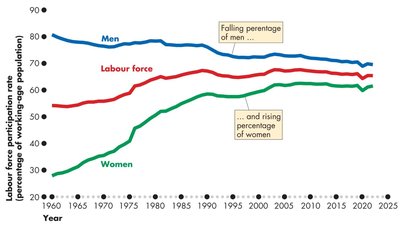
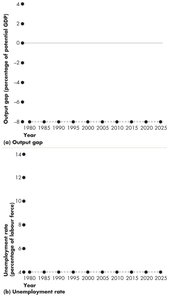
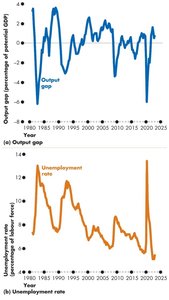
The unemployment rate fluctuates with the business cycle, rising during recessions and peaking after recessions end. Labour force participation and employment rates have increased over time, especially among women.
Participation Rate Trends
Women's participation rate rose from 28% in 1960 to 62% in 2023, due to higher education, technological change, and economic necessity.
Men's participation rate has declined over the same period.
Limitations of the Unemployment Rate
Discouraged searchers: Individuals who want work but have stopped searching due to repeated failure are not counted as unemployed.
Long-term future starts: People with jobs starting in more than four weeks are not counted as unemployed.
Involuntary part-timers: Part-time workers seeking full-time jobs are not classified as unemployed.
Types of Unemployment
Classification of Unemployment
Frictional unemployment: Results from normal labour market turnover, such as job search and transitions.
Structural unemployment: Caused by technological change or foreign competition altering the skills or locations required for jobs.
Cyclical unemployment: Associated with the business cycle, rising during recessions and falling during expansions.

Natural Unemployment and Full Employment
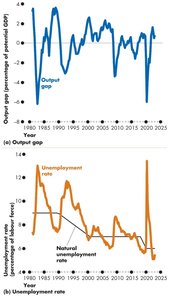
Natural unemployment: The sum of frictional and structural unemployment, occurring when there is no cyclical unemployment.
Natural unemployment rate: Natural unemployment as a percentage of the labour force.
Full employment: The situation where the actual unemployment rate equals the natural unemployment rate.
The natural unemployment rate is influenced by factors such as age distribution, structural change, real wage rates, and unemployment benefits.
Real GDP, Potential GDP, and the Output Gap
Potential GDP: The level of real GDP produced at full employment.
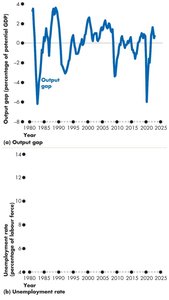
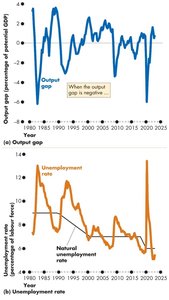
Output gap: The difference between real GDP and potential GDP.
When the output gap is negative, unemployment exceeds the natural rate.
Price Level, Inflation, and Deflation
Definitions and Importance
Price level: The average level of prices in the economy.
Inflation: A persistent rise in the price level.
Deflation: A persistent fall in the price level.
Measuring inflation is crucial for distinguishing between nominal and real values of economic variables.
Problems of Inflation and Deflation
Unpredictable inflation or deflation redistributes income and wealth, reduces real GDP and employment, and diverts resources from productive uses.
The Consumer Price Index (CPI)
CPI: Measures the average price paid by urban consumers for a fixed basket of goods and services.
The reference base period is set to 100 (currently 2002).
For example, a CPI of 155.3 in March 2023 means prices are 55.3% higher than in 2002.
Constructing the CPI
Select the CPI basket based on consumer expenditure surveys.
Conduct a monthly price survey in major cities.
Calculate the CPI using the formula:
Example Calculation
Suppose the CPI basket costs $50 in the base period and $70 in the current period.
This means the price level is 40% higher than in the base period.
Measuring the Inflation Rate
The inflation rate is the percentage change in the CPI from one year to the next:
Biases in the CPI
New goods bias: New products may be more expensive than those they replace, overstating inflation.
Quality change bias: Improvements in quality are counted as price increases.
Commodity substitution bias: The fixed basket does not account for consumers substituting cheaper goods.
Outlet substitution bias: The CPI does not reflect shifts to lower-cost retailers.
Alternative Price Indexes
GDP deflator: It is a broader measure than the CPI, covering all final goods and services produced domestically.
Chained price index for consumption (CPIP): An alternative measure that adjusts for changes in consumption patterns.
Core Inflation Rate
The core inflation rate excludes volatile items from the CPI basket to better reveal underlying inflation trends.
The Bank of Canada uses the CPI-trim measure for this purpose.
Real Variables in Macroeconomics
To convert nominal variables to real values, use the GDP deflator. For example:
Additional info: The real interest rate is calculated differently and is not simply the nominal rate deflated by the GDP deflator.
