 Back
Monitoring the Value of Production: GDP – Principles of Macroeconomics Study Notes
Study Guide - Smart Notes
 Tailored notes based on your materials, expanded with key definitions, examples, and context.
Monitoring the Value of Production: GDP
Macroeconomics vs. Microeconomics
Macroeconomics focuses on the overall economy, measuring total production, income, and expenditure, while microeconomics examines individual markets. The challenge in macroeconomics is to combine the value of diverse goods and services into a single measure.
Microeconomics: Studies individual markets (e.g., apples).
Macroeconomics: Measures total production across all markets (e.g., apples, oranges, smartphones, cars).
Key Challenge: Combining different goods into one value requires a standardized accounting method.
Gross Domestic Product (GDP): Definition and Components
Gross Domestic Product (GDP) is the market value of all final goods and services produced within a country during a specific time period. It is the most common measure of a country's productivity and wealth.
Market Value: The prices at which items are traded in markets.
Final Goods: Goods bought by their final user; only these count toward GDP.
Intermediate Goods: Goods used as components in final goods; not counted in GDP.
Domestic Production: Only goods produced within the country are included.
Time Period: GDP is measured over a quarter or a year.
Example: Final vs. Intermediate Goods
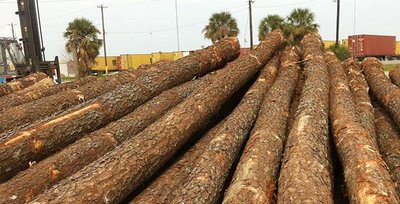
Consider the production chain: Bob the Lumberjack sells logs (intermediate good) to Lumber Co, which turns them into plywood (intermediate good). Christine buys plywood to make a cornhole board (final good), which she sells. Only the cornhole board's value counts toward GDP.

The Circular Flow of Expenditure and Income
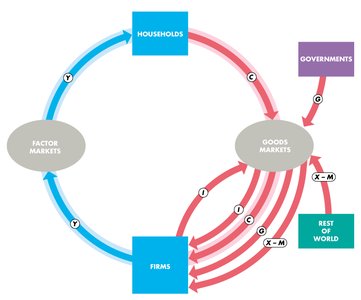
The circular flow model illustrates how payments move through the economy, connecting households, firms, governments, and the rest of the world. Payments for goods and services are expenditures, while payments for factors of production are income.
Expenditure: Payments for goods and services (red arrows).
Income: Payments for labor, capital, and land (blue arrows).
Types of Expenditure
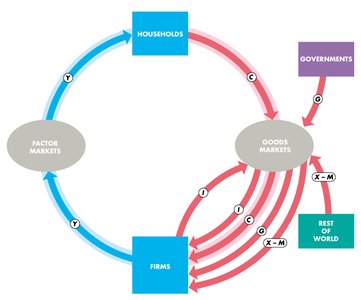
There are four main types of expenditure that contribute to GDP:
Consumption Expenditure (C): Payments from households to firms for goods and services. Largest component of GDP.
Investment (I): Payments from firms to firms for capital goods (e.g., delivery vans). Includes gross and net investment.
Government Expenditure (G): Payments from governments to firms for goods and services (e.g., roads, tanks). Taxes are not included.
Net Exports (X-M): Exports minus imports; measures payments from the rest of the world.
Investment: Gross vs. Net
Gross Investment: Total spent on new and replacement capital.
Net Investment: Increase in capital value; calculated as gross investment minus depreciation.
Depreciation: Decrease in capital value due to wear, tear, and obsolescence.
Formula for Net Investment
Aggregate Expenditure and Income Approaches
GDP can be measured by adding up all expenditures on final goods (expenditure approach) or all income earned from producing those goods (income approach).
Aggregate Expenditure:
Aggregate Income:
GDP Equation:
Nominal GDP vs. Real GDP
Nominal GDP values goods and services at current-year prices, while Real GDP values them at base-year prices to account for inflation and allow comparisons over time.
Nominal GDP: Value at current-year prices.
Real GDP: Value at base-year prices; uses current-year quantities and base-year prices.
Formula for Real GDP
Real GDP per Person and Potential GDP
Real GDP per person measures average standard of living, while potential GDP is the highest sustainable level of GDP given available resources.
Real GDP per person:
Potential GDP: Maximum sustainable GDP in the long run.
The Business Cycle
Real GDP fluctuates around potential GDP, following a business cycle with four phases: expansion, peak, recession, and trough. Expansions are typically longer and larger than recessions.
Expansion: Real GDP increases.
Peak: Temporary high point.
Recession: Real GDP decreases.
Trough: Temporary low point.
Comparisons Across Countries: Exchange Rates and PPP
Comparing real GDP across countries requires converting values using exchange rates, but this can be misleading due to differences in price levels. Purchasing Power Parity (PPP) adjusts for price differences to better compare standards of living.
Exchange Rate Conversion: Converts foreign GDP to domestic currency.
PPP Adjustment: Uses same prices to value goods in both countries.
Example: Big Mac Prices
Big Mac costs $5.79 in the US and 26.50 yuan ($3.95) in China, illustrating lower prices in China and the need for PPP adjustment.
Limitations of Real GDP
Real GDP does not account for all valuable activities and has several limitations:
Household Production: Untraded productive activities are not counted.
Underground Economic Activity: Goods and services paid for but not observed by government (e.g., cash under the table).
Leisure: Activities for fun are not included, even though they contribute to well-being.
Environmental Quality: Clean air and water are valuable but not reflected in GDP.
New Goods: Difficulty in valuing goods invented after the base year.
Alternative Measures of Economic Well-Being
Other measures have been suggested to address GDP's limitations, such as the Human Development Index, Green Net National Product, and Happiness Index. Despite its flaws, GDP remains the most-used statistic in macroeconomics.
