 Back
BackMonitoring the Value of Production: GDP (Gross Domestic Product)
Study Guide - Smart Notes
 Tailored notes based on your materials, expanded with key definitions, examples, and context.
Monitoring the Value of Production: GDP
Introduction to GDP
Gross Domestic Product (GDP) is a central concept in macroeconomics, measuring the market value of all final goods and services produced within a country during a specific period. Understanding GDP is essential for evaluating economic performance, living standards, and the effectiveness of economic policies.
Gross Domestic Product Defined
What is GDP?
GDP is the market value of all final goods and services produced in a country in a given time period.
It reflects the total output of an economy and serves as a key indicator of economic health.
GDP can be measured by total expenditure on final goods and services or by total income earned from production.
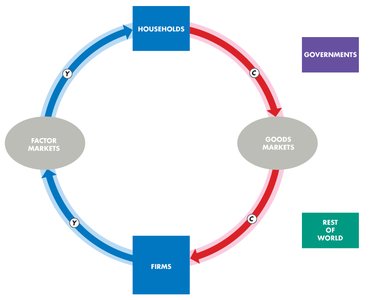
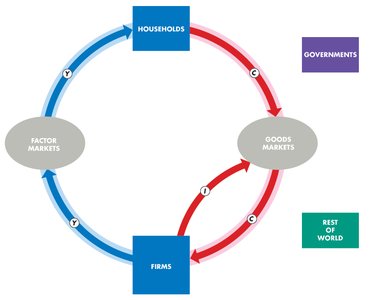
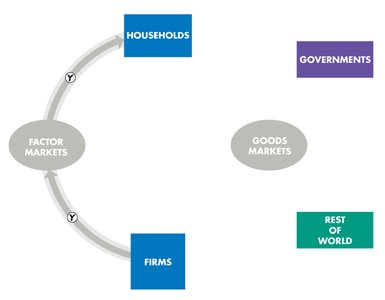
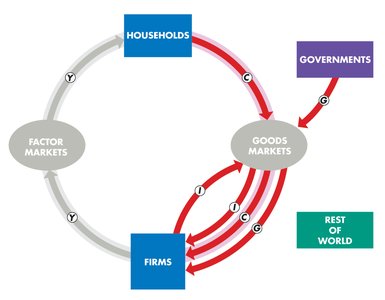
GDP and the Circular Flow of Expenditure and Income
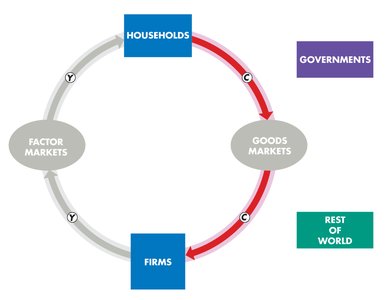
The circular flow model illustrates the equality of income and expenditure in an economy, showing transactions among households, firms, governments, and the rest of the world.
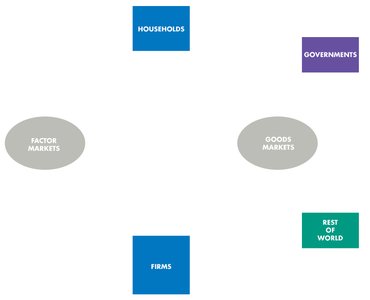
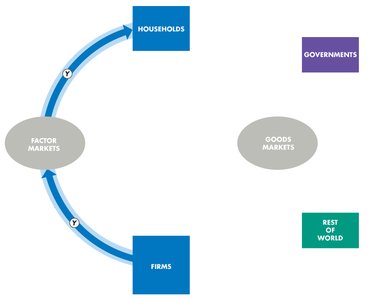
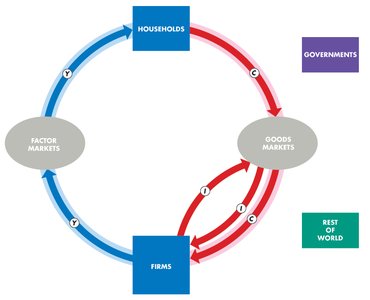
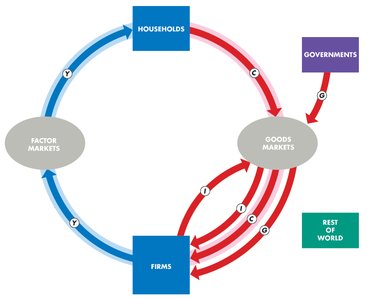
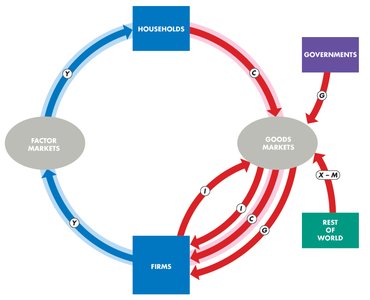
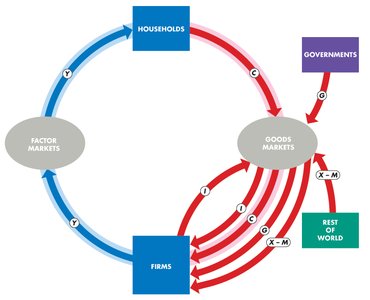
Households sell labor, capital, and land in factor markets; firms pay income (wages, interest, rent, profit) to households.
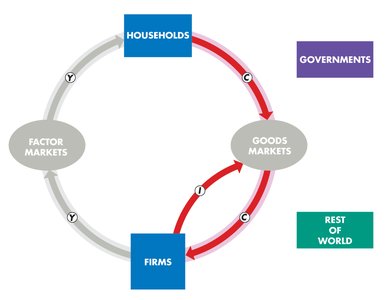
Consumption expenditure (C) is the total payment for consumer goods and services.
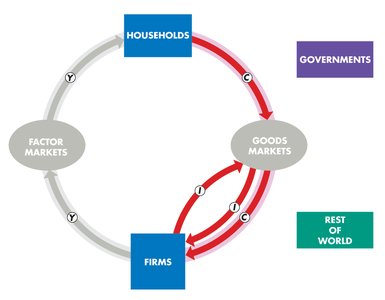
Investment (I) is the purchase of new capital goods and additions to inventories.
Government expenditure (G) is the total government spending on goods and services.
Net exports (X – M) is the value of exports minus imports.
GDP Formula
The sum of all expenditures equals total income:
This equation shows that GDP can be measured either by total expenditure or total income.
Gross vs. Net Domestic Product
Gross means before deducting depreciation of capital.
Net means after deducting depreciation.
Depreciation is the decrease in value of capital due to wear and tear or obsolescence.
Net investment = Gross investment − Depreciation
Measuring Canadian GDP
The Expenditure Approach
The expenditure approach sums all expenditures on final goods and services:
Item | Symbol | Amount in 2023 (billions of dollars) | Percentage of GDP |
|---|---|---|---|
Consumption expenditure | C | 1,579 | 56.1 |
Investment | I | 541 | 19.2 |
Government expenditure | G | 706 | 25.1 |
Net exports | NX | -13 | -0.4 |
Statistical discrepancy | 1 | 0.0 | |
Gross domestic product | Y | 2,814 | 100.0 |
The Income Approach
The income approach sums all incomes earned by factors of production:
Compensation of employees (W): Wages and benefits paid to labor.
Other factor incomes (OFI): Interest, rent, profit, and self-employment income.
Depreciation: Added to obtain gross income.
To convert from factor cost to market prices, add indirect taxes and subtract subsidies.
Item | Amount in 2023 (billions of dollars) | Percentage of GDP |
|---|---|---|
Compensation of employees | 1,440 | 51.2 |
Other factor incomes | 613 | 21.8 |
Depreciation | 470 | 16.7 |
Gross domestic income at factor cost | 2,523 | 89.7 |
Indirect taxes less subsidies | 292 | 10.3 |
GDP at basic prices | 2,815 | 100.0 |
Statistical discrepancy | -1 | -0.0 |
Gross domestic product | 2,814 | 100.0 |
Nominal GDP and Real GDP
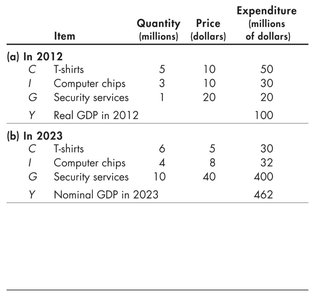
Definitions
Nominal GDP: Value of production in a given year at current prices.
Real GDP: Value of production in a given year at the prices of a reference base year (e.g., 2012).
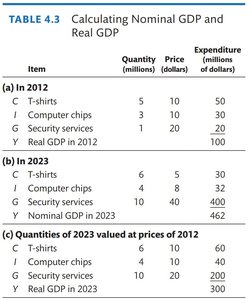
Calculating Real GDP
To calculate real GDP, use the quantities produced in the current year and the prices from the base year.

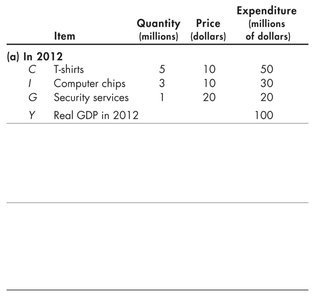
Item | Quantity (millions) | Price (dollars) | Expenditure (millions of dollars) |
|---|---|---|---|
(a) In 2012 | |||
T-shirts (C) | 5 | 10 | 50 |
Computer chips (I) | 3 | 10 | 30 |
Security services (G) | 1 | 20 | 20 |
Real GDP in 2012 (Y) | 100 | ||
(b) In 2023 | |||
T-shirts (C) | 6 | 5 | 30 |
Computer chips (I) | 4 | 8 | 32 |
Security services (G) | 10 | 40 | 400 |
Nominal GDP in 2023 (Y) | 462 | ||
(c) Quantities of 2023 valued at prices of 2012 | |||
T-shirts (C) | 6 | 10 | 60 |
Computer chips (I) | 4 | 10 | 40 |
Security services (G) | 10 | 20 | 200 |
Real GDP in 2023 (Y) | 300 | ||
The Uses and Limitations of Real GDP
Uses of Real GDP
Comparing the standard of living over time (real GDP per person).
Comparing the standard of living across countries.
Real GDP per person is calculated as:
Potential GDP and the Business Cycle
Potential GDP: The value of real GDP when all resources are fully employed.
Business cycle: Periodic fluctuations in real GDP, consisting of expansions (rising GDP) and recessions (falling GDP).
Turning points: Peak (highest point before a downturn) and trough (lowest point before an upturn).
Limitations of Real GDP
Excludes household production (e.g., unpaid domestic work).
Excludes underground economic activity (unreported transactions).
Does not account for leisure time or environmental quality.
Mathematical Note: Chained-Dollar Real GDP
Calculating Chained-Dollar Real GDP
Value production in prices of adjacent years.
Find the average of two percentage changes (using both years' prices).
Link (chain) to the reference base year to create a continuous series.
Chained-dollar real GDP growth rates depend only on prices and quantities in adjacent years, not on the choice of base year. Changing the base year alters the level of real GDP but not the growth rates.
Summary Table: Key GDP Concepts
Concept | Definition |
|---|---|
GDP | Market value of all final goods and services produced in a country in a given period |
Nominal GDP | GDP measured at current prices |
Real GDP | GDP measured at base-year prices |
Potential GDP | GDP when all resources are fully employed |
Business Cycle | Fluctuations in real GDP over time (expansion, recession) |
Chained-Dollar Real GDP | Real GDP calculated using prices of adjacent years and chaining growth rates |
