 Back
BackPrinciples of Macroeconomics: Final Exam Study Guide
Study Guide - Smart Notes
 Tailored notes based on your materials, expanded with key definitions, examples, and context.
Introduction to Macroeconomics
What is Macroeconomics?
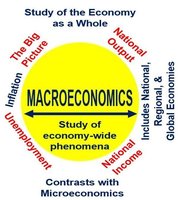
Macroeconomics is the study of the economy as a whole, focusing on broad aggregates and overall economic phenomena such as national output, income, inflation, and unemployment. It contrasts with microeconomics, which examines individual markets and agents.
Key Focus: National and global economic performance, policy, and trends.
Major Topics: Output (GDP), unemployment, inflation, national income, and the impact of government policies.
Introductory Economic Models
Thinking Like an Economist
Economists use models to simplify and analyze complex real-world phenomena. These models help us understand how economies function and predict the effects of policy changes.
Economic Choice: Scarcity forces individuals and societies to make choices, leading to opportunity costs.
Incentives: People respond to incentives, which shape economic behavior in both private and public sectors.
Supply and Demand
Market Equilibrium
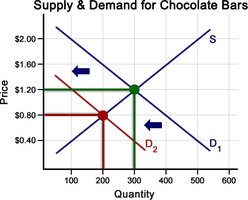
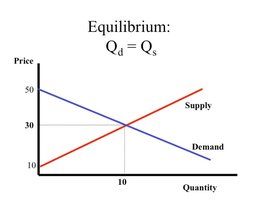
Supply and demand are fundamental concepts that determine prices and quantities in a free market. The intersection of the supply and demand curves indicates the equilibrium price and quantity, where the market clears.
Equilibrium: The point where quantity demanded equals quantity supplied.
Shifts: Changes in supply or demand shift the curves, leading to new equilibrium prices and quantities.
Government Intervention
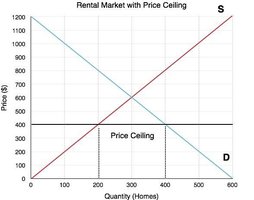
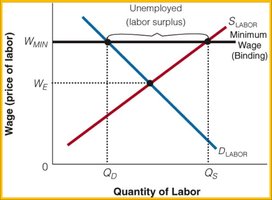
Government policies such as price ceilings (maximum legal prices) and price floors (minimum legal prices) can disrupt market equilibrium, causing shortages or surpluses.
Price Ceiling: Leads to shortages when set below equilibrium price.
Price Floor: Leads to surpluses when set above equilibrium price (e.g., minimum wage laws).
Elasticity
Price Elasticity of Demand and Supply
Elasticity measures how much the quantity demanded or supplied responds to changes in price. It is a key concept for understanding market dynamics and the effects of policy interventions.
Formula:
Interpretation: High elasticity means consumers/producers are very responsive to price changes; low elasticity means they are less responsive.
Measuring National Output and Income
GDP and National Income
Gross Domestic Product (GDP) is the total market value of all final goods and services produced within a country in a given period. It is a primary measure of national output and economic health.
Keynesian View: Where is national output, is consumption, is investment, is government spending, and is net exports.
Monetarist View: Where is the price level, is output, is money supply, and is velocity of money.
Comparative Advantage and International Trade
Comparative vs. Absolute Advantage
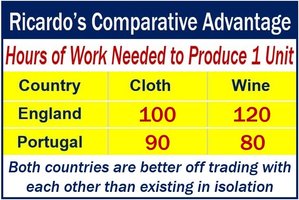
Comparative advantage explains how countries benefit from trade by specializing in the production of goods for which they have the lowest opportunity cost, even if one country has an absolute advantage in all goods.
Absolute Advantage: The ability to produce more of a good with the same resources.
Comparative Advantage: The ability to produce a good at a lower opportunity cost than another country.
Production Possibilities Curve (PPC)
Tradeoffs and Opportunity Costs
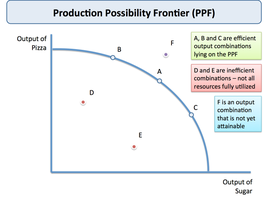
The Production Possibilities Curve (PPC) illustrates the tradeoffs between the production of two goods, showing the maximum possible output combinations given available resources and technology.
Efficient Points: On the curve, resources are fully utilized.
Inefficient Points: Inside the curve, resources are underutilized.
Unattainable Points: Outside the curve, not possible with current resources.
Multiplier Principle
Marginal Propensity to Consume (MPC)
The multiplier effect describes how an initial change in spending leads to a larger change in overall economic output. The size of the multiplier depends on the marginal propensity to consume (MPC).
Multiplier Formula:
Example: If MPC = 0.75, a $1,000,000 injection leads to a total increase in spending of $4,000,000.
The Circular Flow of Income
Key Markets in the Circular Flow
The circular flow model illustrates how money moves through the economy between households and businesses via four key markets: resource, goods & services, loanable funds, and foreign exchange.
Resource Market: Businesses demand resources; households supply them for income.
Goods & Services Market: Households buy goods/services; businesses supply them (GDP).
Loanable Funds Market: Balances saving and borrowing among households, businesses, and governments.
Foreign Exchange Market: Balances imports and exports, including capital flows.
The Financial System and Money Creation
Fractional Reserve Banking
Banks operate on a fractional reserve system, keeping only a portion of deposits as reserves and lending out the rest. This process multiplies the money supply.
Money Multiplier Formula:
Example: With a 20% reserve ratio, a $1,000 deposit can create up to $5,000 in new money through repeated lending.
Stage | New Cash Deposits | New Required Reserves | Potential Demand Deposits Created |
|---|---|---|---|
Initial deposit (bank A) | $1,000.00 | $200.00 | $800.00 |
Second stage (bank B) | $800.00 | $160.00 | $640.00 |
Third stage (bank C) | $640.00 | $128.00 | $512.00 |
Fourth stage (bank D) | $512.00 | $102.40 | $409.60 |
Fifth stage (bank E) | $409.60 | $81.92 | $327.68 |
Sixth stage (bank F) | $327.68 | $65.54 | $262.14 |
Seventh stage (bank G) | $262.14 | $52.43 | $209.71 |
Total | $1,000.00 | $1,000.00 | $5,000.00 |
Aggregate Demand and Aggregate Supply
Macroeconomic Equilibrium
The output of the economy is at full employment when Long-Run Aggregate Supply (LRAS), Short-Run Aggregate Supply (SRAS), and Aggregate Demand (AD) are in equilibrium. This determines the economy's potential output.
Fiscal and Monetary Policy
Government and Central Bank Roles
Fiscal policy involves government taxation and spending to influence the economy, while monetary policy refers to the central bank's control of the money supply to achieve macroeconomic goals such as stable prices and full employment.
Fiscal Policy Tools: Government spending, taxation.
Monetary Policy Tools: Open market operations, reserve requirements, discount rate.
Other Key Concepts
Public Choice Theory: Applies economic principles to political decision-making, suggesting that government officials respond to incentives like private individuals.
Price Indices: Tools such as the Consumer Price Index (CPI) are used to measure inflation and calculate real values.
Economic Fluctuations: Since 1950, GDP fluctuations have become less severe, indicating increased economic stability.
Multiplier Effect in Keynesian Model: Small changes in spending can lead to larger changes in output and employment.
Exam Preparation and Grading
Assessment Structure
Grades are based on class contribution, mid-term exam, final exam, and homework assignments. Completing all homework is required to pass the course.
Component | Weight |
|---|---|
Class Contribution | 20% |
Mid-Term Exam | 15% |
Final Exam | 35% |
Homework | 30% |
Total | 100% |
Key Exam Topics: Supply and demand, national output models, comparative advantage, opportunity cost, public choice theory, price indices, elasticity, aggregate demand and supply, fiscal and monetary policy, circular flow of income, and the multiplier principle.
