 Back
BackPrinciples of Macroeconomics: Foundations and Models
Study Guide - Smart Notes
 Tailored notes based on your materials, expanded with key definitions, examples, and context.
Principles of Economics
Introduction to Economics
Economics is the study of how individuals and societies allocate scarce resources to satisfy unlimited wants. The field is divided into microeconomics, which focuses on individual households and firms, and macroeconomics, which examines the economy as a whole.
Scarcity: A situation in which unlimited wants exceed the limited resources available to fulfill those wants.
Economics: The study of the choices people make to attain their goals, given their scarce resources.
Economic Model: A simplified version of reality used to analyze real-world economic situations.
Three Key Economic Ideas
Economists use three foundational ideas to analyze choices and interactions in markets:
People are rational: Individuals systematically and purposefully do the best they can to achieve their objectives, using all available information and weighing costs and benefits.
People respond to economic incentives: Incentives are rewards or punishments that motivate behavior. Rational people compare costs and benefits and respond accordingly. Example: Higher gas prices increase hybrid car sales; higher cigarette taxes reduce teen smoking.
Optimal decisions are made at the margin: Many decisions involve marginal changes—incremental adjustments to an existing plan. The optimal decision is where marginal benefit equals marginal cost ().
Example: A student considers whether to attend college for an additional year by comparing the extra income from more education to the fees and foregone wages.
Trade-offs and Opportunity Cost
Because resources are scarce, every choice involves a trade-off. The opportunity cost is the highest-valued alternative that must be given up to engage in an activity.
Trade-off: Producing more of one good or service means producing less of another.
Opportunity Cost: The value of the next best alternative forgone.
The Economic Problems All Societies Must Solve
Role of the Economist
Economists act as both scientists (explaining the world) and policy advisors (improving outcomes). They use the scientific method to develop and test theories about economic behavior.
Assumptions and Models
Assumptions simplify complex realities, making economic problems easier to analyze. Models are highly simplified representations of reality, used to study economic issues.
Example: Assuming only two countries and two goods in international trade models.
Steps in Model Development
Decide on assumptions.
Formulate a testable hypothesis.
Use economic data to test the hypothesis.
Revise the model if it fails to explain the data well.
Retain the revised model for future analysis.
Positive vs. Normative Analysis
Positive Analysis: Concerned with what is; objective and fact-based.
Normative Analysis: Concerned with what ought to be; subjective and value-based.
Economics primarily focuses on positive analysis, measuring costs and benefits of different actions.
Microeconomics and Macroeconomics
Division of Economics
Microeconomics: Studies how households and firms make choices, interact in markets, and how governments influence these choices.
Macroeconomics: Studies the economy as a whole, including inflation, unemployment, and economic growth.
Economic Models and Graphs
Using Graphs and Formulas
Graphs are simplified visual representations of economic relationships, similar to street maps. They help illustrate data and relationships between variables.
Graphs of One Variable
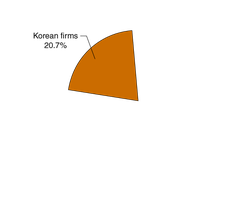
Bar graphs and pie charts are commonly used to display values for a single economic variable, such as market share.

Time-Series Graphs
Time-series graphs show how a variable changes over time, such as a company's sales from year to year. The scale of the axes can affect the visual interpretation of fluctuations.
Graphs of Two Variables
Two-dimensional graphs plot the relationship between two variables, such as price and quantity. Each point represents a combination of the two variables.
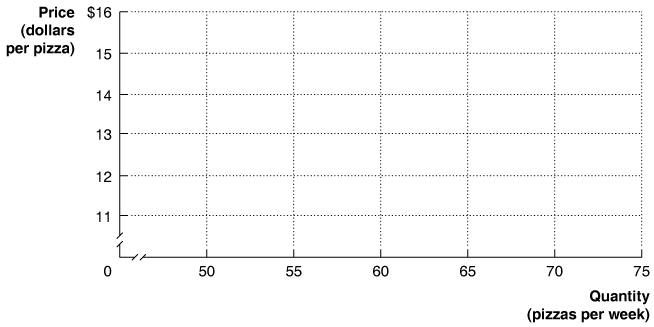
Slopes of Lines
The slope of a line measures the rate at which one variable changes in relation to another. For example, if the price of pizza decreases from $14 to $12 and quantity demanded increases from 55 to 65, the slope is:
Positive and Negative Relationships
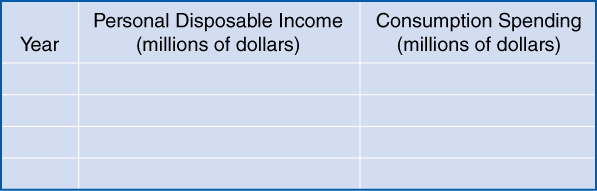
A positive relationship means both variables move in the same direction; a negative relationship means they move in opposite directions. For example, as personal disposable income increases, so does consumption spending.
Year | Personal Disposable Income (millions of dollars) | Consumption Spending (millions of dollars) |
|---|---|---|
Linear and Nonlinear Relationships
Most economic relationships are nonlinear, but linear approximations are often used for simplicity. Nonlinear relationships are represented by curves, and the slope can change at different points.
Measuring the Slope of a Nonlinear Curve
The slope at a specific point on a curve is measured by the tangent line at that point. For example, the slope of the tangent line at point B might be 75, while at point C it could be 150, indicating a steeper curve as output increases.
Formulas in Economics
Percentage Change: Used to measure growth rates, such as GDP growth.
Example: Calculating the growth rate of real GDP from one year to the next.
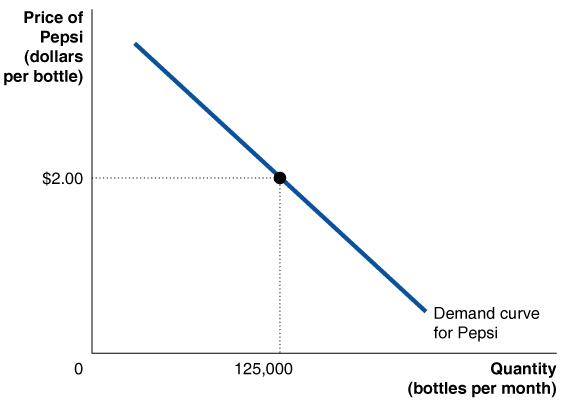
Areas of Rectangles and Triangles
The area under or between curves can represent economic quantities, such as total revenue.
Rectangle: Area = base × height
Triangle: Area = 1/2 × base × height
Example: If a firm sells 125,000 bottles at $2.00 each, total revenue is $250,000 (area of the rectangle).
The Circular-Flow Diagram
Model of the Economy
The circular-flow diagram is a visual model showing how dollars flow through markets among households and firms. It illustrates the interactions in product and factor markets.
Households: Supply factors of production (labor, capital, natural resources, entrepreneurial ability) and purchase goods and services.
Firms: Hire factors of production and produce goods and services.
Product Market: Where goods and services are bought and sold.
Factor Market: Where resources (labor, capital, etc.) are bought and sold.


The Gains from Free Markets
Free Market Mechanism
A free market is one with few government restrictions on production, sale, or employment of resources. The market mechanism relies on flexible prices and the self-interest of individuals to allocate resources efficiently, as described by Adam Smith's concept of the "invisible hand." Countries closer to the free market model tend to achieve higher living standards.
Flexible Prices: Allow markets to adjust to changes in consumer wants.
Invisible Hand: The idea that individuals' pursuit of self-interest leads to outcomes that benefit society as a whole.
