 Back
BackReal GDP and the Price Level in the Long Run: Macroeconomic Analysis
Study Guide - Smart Notes
 Tailored notes based on your materials, expanded with key definitions, examples, and context.
Chapter 9: Real GDP and the Price Level in the Long Run
9.1 Output Growth and the Long-Run Aggregate Supply Curve
The long-run aggregate supply (LRAS) curve represents the total real output of goods and services that an economy can produce when all resources are fully employed and input prices have fully adjusted. This concept is central to understanding the economy's productive capacity and the effects of economic growth.
Aggregate Supply: The total of all planned production for the economy.
Long-Run Aggregate Supply (LRAS) Curve: A vertical line representing real GDP at full employment, where firms and workers have full information and input prices have adjusted to output prices.
Production Possibilities Curve (PPC): Shows the maximum possible output combinations of two goods that can be produced with available resources and technology.
Determinants of LRAS: Resource endowments and technology.
Growth: Outward shifts of the PPC or LRAS curve, caused by increases in labor, productivity, capital accumulation, or technological improvements.
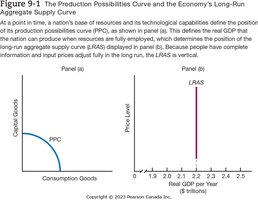
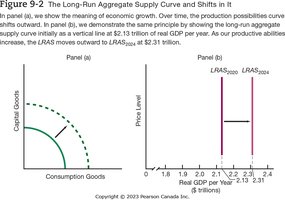
Additional info: The LRAS is vertical because, in the long run, changes in the price level do not affect the total output; the economy operates at its full potential.
9.2 Total Expenditures and Aggregate Demand
The aggregate demand (AD) curve shows the total planned expenditures on all final goods and services at various price levels. Understanding why the AD curve slopes downward and what causes it to shift is crucial for macroeconomic analysis.
Aggregate Demand: The total of all planned expenditures in the economy.
Aggregate Demand Curve (AD): Slopes downward, indicating that as the price level falls, the quantity of real GDP demanded increases.
Reasons for Downward Slope:
Real-Balance Effect (Wealth Effect): A lower price level increases the real value of money balances, boosting spending.
Interest Rate Effect: Lower price levels reduce interest rates, encouraging more borrowing and spending.
Open Economy Effect: Lower domestic prices make domestic goods more attractive to foreigners, increasing net exports.
Shifts in AD: Any non-price-level change that increases (rightward shift) or decreases (leftward shift) aggregate spending, such as changes in consumer confidence, fiscal policy, or foreign demand.
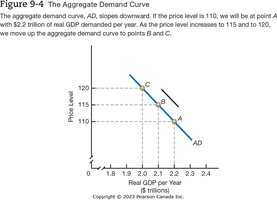
Additional info: The AD curve is distinct from the demand curve for a single good, as it encompasses all goods and services in the economy.
Table: Determinants of Aggregate Demand
Determinant | Effect on AD |
|---|---|
Consumer Confidence | Increase shifts AD right; decrease shifts AD left |
Government Spending | Increase shifts AD right; decrease shifts AD left |
Taxes | Decrease shifts AD right; increase shifts AD left |
Foreign Income | Increase shifts AD right; decrease shifts AD left |
Money Supply | Increase shifts AD right; decrease shifts AD left |
Additional info: Table entries inferred from standard macroeconomic determinants. |
9.3 Long-Run Equilibrium and the Price Level
Long-run equilibrium in the economy occurs where the aggregate demand curve intersects the long-run aggregate supply curve. This intersection determines the equilibrium price level and real GDP at full employment.
Long-Run Equilibrium: The price level at which total planned real expenditures equal real GDP at full employment.
Economic Growth and Deflation: If aggregate demand remains stable while LRAS shifts rightward (due to growth), the price level falls, resulting in secular deflation.
Avoiding Secular Deflation: If AD shifts outward at the same pace as LRAS, the price level remains stable.
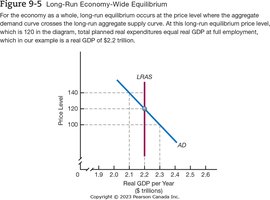
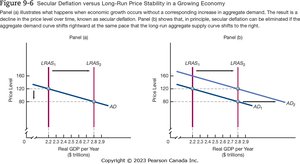
Additional info: Secular deflation is a persistent decline in prices due to economic growth with stable aggregate demand.
9.4 Causes of Inflation
Inflation can result from both supply-side and demand-side factors. Understanding these causes is essential for analyzing persistent inflation in modern economies.
Supply-Side Inflation: Caused by a leftward shift in LRAS, such as reductions in labor force participation or higher taxes on wages.
Demand-Side Inflation: Occurs when aggregate demand increases faster than LRAS, pushing up the price level.
Persistent Inflation: Most often explained by aggregate demand growing faster than aggregate supply.
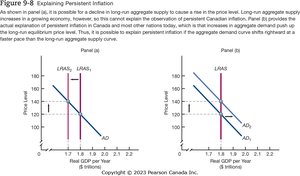
Additional info: In Canada and other advanced economies, persistent inflation is typically demand-driven rather than supply-driven.
International and Historical Examples
Eurozone Low Inflation: Attributed to slow growth in the money supply and rapid growth in real GDP (rightward LRAS shift).
Turkey's Inflation: Rapid money supply growth outpaced LRAS growth, causing inflation despite economic growth.
Japan's Policy: Reducing work hours to increase productivity and shift LRAS rightward.
Empirical Evidence: Canada
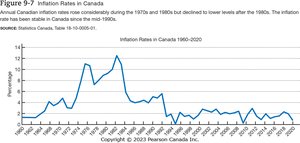
Inflation Rates: High in the 1970s and 1980s, stable since the mid-1990s.
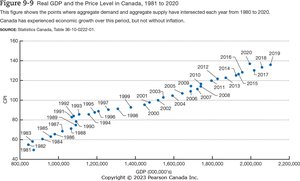
Real GDP and Price Level (1981–2020): Economic growth has occurred alongside inflation, as shown by the intersection points of AD and AS over time.
Summary of Key Learning Objectives
The LRAS curve is vertical at full employment real GDP; economic growth shifts LRAS outward.
The AD curve slopes downward due to the real-balance, interest rate, and open economy effects; it shifts with non-price-level changes.
Long-run equilibrium is where AD and LRAS intersect; economic growth with stable AD causes deflation.
Persistent inflation is usually due to AD growing faster than LRAS.
