 Back
BackStudy Guide: The Interaction of Demand and Supply in Markets
Study Guide - Smart Notes
 Tailored notes based on your materials, expanded with key definitions, examples, and context.
Where Prices Come From: The Interaction of Demand and Supply
Our Model of a Market
To analyze how prices are determined in markets, economists use the model of a perfectly competitive market. This model assumes many buyers and sellers, identical products, and no barriers to entry for new firms. While these assumptions are restrictive, the model is useful for understanding price formation in many real-world markets.
The Demand Side of the Market
Demand represents the behavior of buyers in the market. Market demand is the total demand by all consumers for a given good or service. The relationship between price and quantity demanded is central to understanding demand.
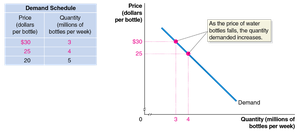
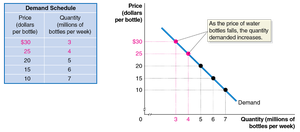
Demand schedule: A table showing the relationship between the price of a product and the quantity demanded.
Demand curve: A graphical representation of the demand schedule, showing how quantity demanded changes with price.
Quantity demanded: The amount of a good or service a consumer is willing and able to purchase at a given price.
Law of demand: Holding all else constant, as the price of a product falls, the quantity demanded increases; as the price rises, the quantity demanded decreases.
What Explains the Law of Demand?
Substitution effect: When the price of a good falls, consumers substitute toward the cheaper good.
Income effect: A lower price increases consumers' purchasing power, allowing them to buy more.
Ceteris Paribus Condition
When drawing the demand curve, economists assume ceteris paribus ("all else equal"), meaning all other variables are held constant except price and quantity demanded.
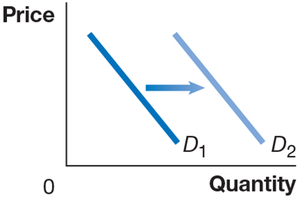
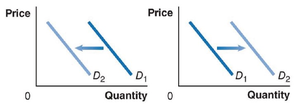
Shifting the Demand Curve
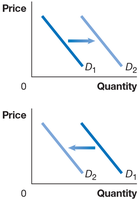
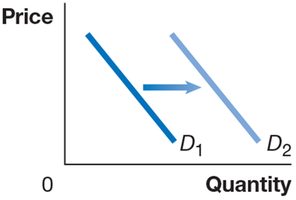
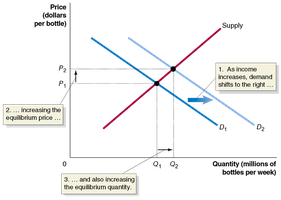
A change in any variable other than price that affects demand causes the entire demand curve to shift. A shift to the right indicates an increase in demand; a shift to the left indicates a decrease.
Variables That Shift Market Demand
Income: Increases demand for normal goods, decreases demand for inferior goods.
Prices of related goods: Substitutes and complements affect demand differently.
Tastes: Changes in consumer preferences can increase or decrease demand.
Population and demographics: More buyers increase demand.
Expected future prices: Anticipation of price changes affects current demand.
Natural disasters and pandemics: Temporary disruptions can shift demand.
Normal and Inferior Goods
Normal good: Demand increases as income rises (e.g., new clothes, restaurant meals).
Inferior good: Demand increases as income falls (e.g., second-hand clothes, instant noodles).
Effects of Changes in the Price of Related Goods
Substitutes: An increase in the price of one increases demand for the other.
Complements: An increase in the price of one decreases demand for the other.
Changes in Tastes
If consumer tastes change, demand for certain products may increase or decrease. For example, successful advertising can increase demand for reusable water bottles.
Changes in Population/Demographics
Demographic shifts, such as an increase in the elderly population, can increase demand for specific goods like medical care.

Changes in Expectations About Future Prices
If consumers expect prices to rise in the future, they may increase demand today. Conversely, expected price drops decrease current demand.
Natural Disasters and Pandemics
Events like hurricanes or pandemics can temporarily disrupt economic activity, shifting demand for certain goods.
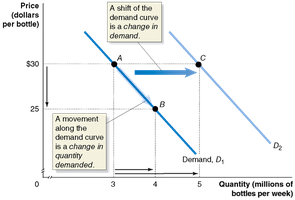
Change in Demand vs. Change in Quantity Demanded
Change in quantity demanded: Movement along the demand curve due to a change in price.
Change in demand: Shift of the entire demand curve due to other factors.
The Supply Side of the Market
Supply represents the behavior of sellers (usually firms) in the market. Market supply is the total amount of a product provided at various prices.
Supply schedule: A table showing the relationship between price and quantity supplied.
Supply curve: A graphical representation of the supply schedule.
Quantity supplied: The amount a firm is willing and able to supply at a given price.
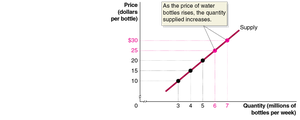
Law of supply: Holding all else constant, increases in price cause increases in quantity supplied; decreases in price cause decreases in quantity supplied.

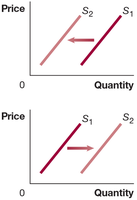
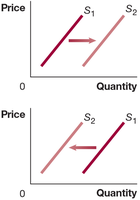
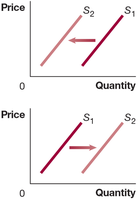
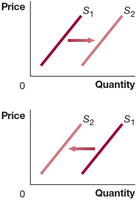
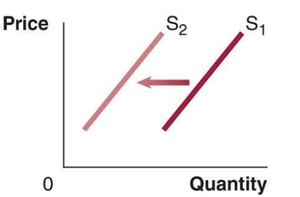
Shifting the Supply Curve
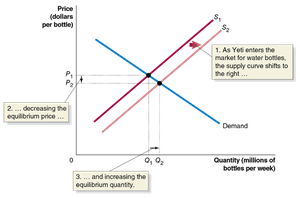
A change in any variable other than price that affects supply causes the entire supply curve to shift. A shift to the right indicates an increase in supply; a shift to the left indicates a decrease.
Variables That Shift Market Supply
Prices of inputs: Higher input prices decrease supply; lower input prices increase supply.
Technological change: Improvements increase supply; restrictions decrease supply.
Prices of related goods in production: Substitutes and complements in production affect supply.
Number of firms: More firms increase supply.
Expected future prices: Anticipation of higher prices may decrease current supply.
Natural disasters and pandemics: Disruptions decrease supply.
Change in Prices of Inputs
Inputs are resources used in production. Changes in input prices affect the profitability and supply of goods.
Technological Change
Technological advancements or restrictions can increase or decrease supply, respectively.
Prices of Related Goods in Production
Substitutes in production: Higher prices for one product may decrease supply of another.
Complements in production: Higher prices for one product may increase supply of another produced jointly.
Number of Firms and Expected Future Prices
More firms in the market increase supply. Firms may adjust supply based on expected future prices.
Natural Disasters and Pandemics
Disruptions such as hurricanes or pandemics can reduce supply by damaging production facilities.
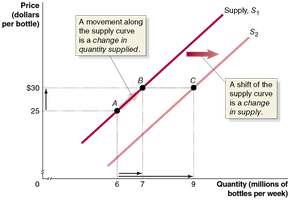
Change in Supply vs. Change in Quantity Supplied
Change in quantity supplied: Movement along the supply curve due to a change in price.
Change in supply: Shift of the entire supply curve due to other factors.
Market Equilibrium: Putting Demand and Supply Together
Market equilibrium occurs when quantity demanded equals quantity supplied. In a perfectly competitive market, this is called a competitive market equilibrium. The equilibrium price and quantity are determined by the intersection of the demand and supply curves.
Equilibrium price: The price at which buyers and sellers agree to trade.
Equilibrium quantity: The quantity traded at the equilibrium price.
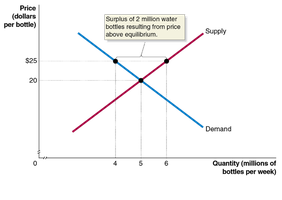
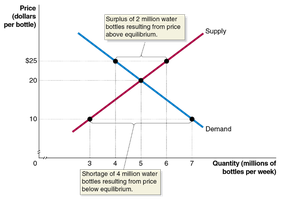
Surpluses and Shortages
Surplus: Quantity supplied exceeds quantity demanded; price tends to fall.
Shortage: Quantity demanded exceeds quantity supplied; price tends to rise.
The Effect of Demand and Supply Shifts on Equilibrium
Shifts in demand or supply curves change the equilibrium price and quantity. The direction of change depends on which curve shifts and by how much.
Increase in demand: Equilibrium price and quantity rise.
Increase in supply: Equilibrium price falls, equilibrium quantity rises.
Simultaneous Shifts in Demand and Supply
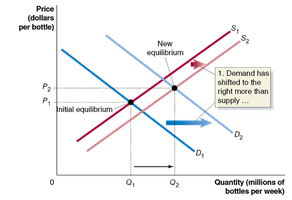
When both demand and supply shift, the effect on equilibrium price is ambiguous without knowing the relative magnitude of the shifts. However, equilibrium quantity will rise if both curves shift to the right.
Shifts of a Curve versus Movements Along a Curve
A shift in the supply or demand curve represents a change in supply or demand, while a movement along the curve represents a change in quantity supplied or demanded due to a change in price. It is important not to confuse these concepts.
Key Formulas
Demand function: Where = quantity demanded, = price, = income, = price of related goods, = tastes, = population, = expectations.
Supply function: Where = quantity supplied, = price, = price of inputs, = technology, = price of related goods, = number of firms, = expectations.
Market equilibrium:
Summary Table: Effects of Shifts on Equilibrium
Change | Equilibrium Price (P) | Equilibrium Quantity (Q) |
|---|---|---|
Increase in Demand | Rises | Rises |
Decrease in Demand | Falls | Falls |
Increase in Supply | Falls | Rises |
Decrease in Supply | Rises | Falls |
Both Demand and Supply Increase | Ambiguous | Rises |
Both Demand and Supply Decrease | Ambiguous | Falls |
Additional info: This study guide expands on the textbook's brief points, providing definitions, examples, and formulas for clarity. Images included are directly relevant to the explanation of each paragraph, visually reinforcing key concepts.
