 Back
Supply and Demand: Principles, Mechanics, and Applications
Study Guide - Smart Notes
 Tailored notes based on your materials, expanded with key definitions, examples, and context.
Supply and Demand Principles
Introduction to Supply and Demand
Supply and demand are fundamental concepts in economics that explain how prices are determined in markets. The interaction between buyers (demand) and sellers (supply) establishes the market price and quantity of goods and services.
Demand: Represents the value consumers place on a good, reflected in their willingness to pay.
Supply: Represents the cost structure of producers, indicating how much they are willing to sell at various prices.
Prices: Act as signals, conveying information about scarcity and incentives to both buyers and sellers.

Demand
The Demand Curve
The demand curve shows the relationship between the price of a good and the quantity demanded, holding other factors constant. It typically slopes downward, indicating that lower prices lead to higher quantities demanded.
Law of Demand: As price decreases, quantity demanded increases; as price increases, quantity demanded decreases.
Real Income Effect: Lower prices increase consumers' purchasing power.
Substitution Effect: Lower prices make a good more attractive relative to substitutes.
Factors Affecting Demand (Demand Shifters)
Several factors can shift the demand curve, changing the quantity demanded at every price.
Income/Wealth: Higher income increases demand for normal goods, decreases demand for inferior goods.
Tastes and Preferences: Changes in consumer preferences can increase or decrease demand.
Expectations: Anticipation of future prices or income affects current demand.
Population/Demographics: More buyers increase market demand.
Price of Related Goods: Substitutes and complements affect demand.


Market Demand
The market demand curve is the horizontal sum of individual demand curves. It reflects the total quantity demanded by all consumers at each price.
High-value consumers: Willing to pay more for a good.
Low-value consumers: Willing to pay less.

Shifts in Demand
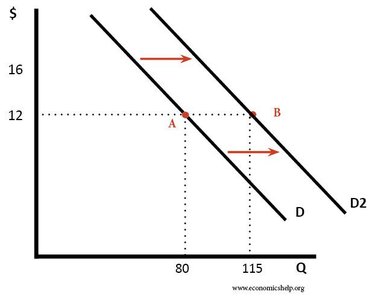
A shift in the demand curve means consumers are willing to buy more or less at every price, often due to changes in the factors listed above.
Increase in Demand: Demand curve shifts right; higher quantity demanded at every price.
Decrease in Demand: Demand curve shifts left; lower quantity demanded at every price.

Supply
The Supply Curve
The supply curve shows the relationship between the price of a good and the quantity supplied, holding other factors constant. It typically slopes upward, indicating that higher prices lead to higher quantities supplied.
Law of Supply: As price increases, quantity supplied increases; as price decreases, quantity supplied decreases.
Production Costs: Lower costs increase supply; higher costs decrease supply.
Factors Affecting Supply (Supply Shifters)
Several factors can shift the supply curve, changing the quantity supplied at every price.
Production Technology: Technological improvements increase supply.
Costs of Resources: Lower input prices increase supply; higher input prices decrease supply.
Expectations: Anticipation of future prices affects current supply.
Number of Sellers: More sellers increase supply.
Prices of Related Commodities: Changes in opportunity costs affect supply.
Natural Disasters: Can decrease supply.
Market Supply
The market supply curve is the horizontal sum of individual supply curves. It reflects the total quantity supplied by all producers at each price.
Low-cost producers: Can supply more at lower prices.
High-cost producers: Require higher prices to supply.
Shifts in Supply
A shift in the supply curve means producers are willing to sell more or less at every price, often due to changes in the factors listed above.
Increase in Supply: Supply curve shifts right; higher quantity supplied at every price.
Decrease in Supply: Supply curve shifts left; lower quantity supplied at every price.
Market Equilibrium
Equilibrium Price and Quantity
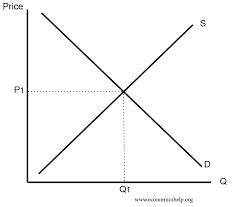
Market equilibrium occurs where the supply and demand curves intersect. At this point, the quantity supplied equals the quantity demanded, and the market clears.
Equilibrium Price: The price at which the market clears.
Equilibrium Quantity: The quantity bought and sold at the equilibrium price.
Surplus and Shortage
When the market is not in equilibrium, surpluses and shortages occur, leading to price adjustments.
Surplus: Quantity supplied exceeds quantity demanded; downward pressure on price.
Shortage: Quantity demanded exceeds quantity supplied; upward pressure on price.
Changes in Equilibrium
Events that shift supply or demand curves change the equilibrium price and quantity. The direction and magnitude of these changes depend on the relative shifts of the curves.
Three-step analysis:
Determine which curve shifts (supply, demand, or both).
Determine the direction of the shift (right or left).
Compare the initial and new equilibrium using supply-and-demand diagrams.
Applications and Examples
Substitutes and Complements
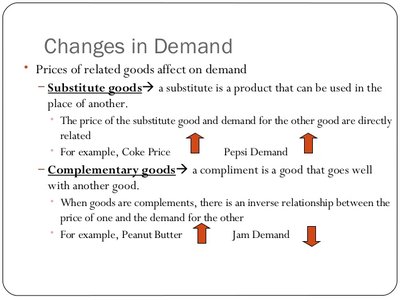
The price of related goods affects demand. Substitute goods can replace each other, while complementary goods are used together.
Substitute Goods: Increase in the price of one increases demand for the other.
Complementary Goods: Increase in the price of one decreases demand for the other.
Financial Markets: Bonds and Stocks
Supply and demand principles also apply to financial assets. The price of bonds and stocks is determined by the interaction of buyers and sellers, influenced by expectations, risk, and returns.
Bonds: Fixed interest payments; price and yield are inversely related.
Stocks: Ownership claims; price reflects expected future profits and dividends.
Factors affecting demand: Risk of default, relative returns, inflation.
Bond Price | Annual Coupon Payment | Current Yield |
|---|---|---|
$1,000,000 | $50,000 | 5% |
$900,000 | $50,000 | 5.6% |
$500,000 | $50,000 | 10% |
Formula:
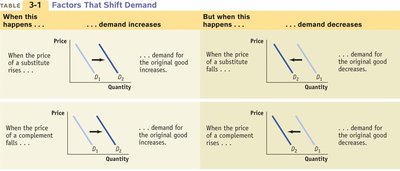
Summary Table: Factors That Shift Demand
Factor | Demand Increases | Demand Decreases |
|---|---|---|
Price of Substitute Rises | Demand for original good increases | Demand for original good decreases |
Price of Complement Falls | Demand for original good increases | Demand for original good decreases |
Income Rises (Normal Good) | Demand increases | Demand decreases |
Income Rises (Inferior Good) | Demand decreases | Demand increases |
Conclusion
Understanding supply and demand is essential for analyzing market outcomes, price changes, and the effects of external events. These principles apply broadly, from goods and services to financial assets, and are foundational to macroeconomic analysis.
