 Back
BackThinking Like an Economist: Methodology, Models, and Graphical Analysis
Study Guide - Smart Notes
 Tailored notes based on your materials, expanded with key definitions, examples, and context.
Thinking Like an Economist
Introduction to Economic Methodology
Economists approach the study of the economy with a scientific mindset, aiming for objectivity and systematic analysis. This chapter explores how economists think, the tools they use, and the distinction between positive and normative statements in economic analysis.
The Economist as Scientist
The Scientific Method in Economics
Scientific Method: Economists use observation, theory, and further observation to understand economic phenomena. However, conducting controlled experiments is often difficult in economics due to the complexity of real-world variables.
Role of Assumptions: Assumptions help simplify complex realities, allowing economists to focus on the most critical aspects of a problem. The art lies in choosing appropriate assumptions for each context.
Economic Models
Definition: Economic models are simplified representations of reality, often using diagrams and equations, to highlight essential relationships and mechanisms.
All models are built on assumptions and omit many real-world details to focus on key concepts.
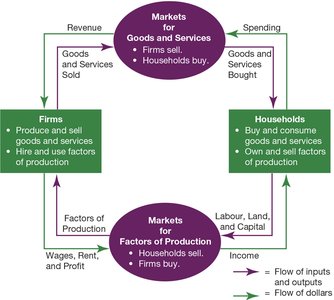
The Circular-Flow Diagram
The circular-flow diagram is a foundational model that illustrates how money and resources move through the economy between households and firms.
Markets for Goods and Services: Firms sell, households buy.
Markets for Factors of Production: Households sell (labor, land, capital), firms buy.
Flows: Inputs and outputs flow in one direction; money flows in the opposite direction.
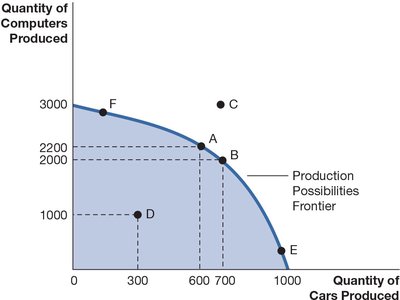
The Production Possibilities Frontier (PPF)
The PPF is a graph that shows the combinations of two goods an economy can produce given its resources and technology.
Points on the PPF: Efficient production combinations.
Points inside the PPF: Inefficient—resources are underutilized.
Points outside the PPF: Unattainable with current resources.
Opportunity Cost: The slope of the PPF represents the opportunity cost of one good in terms of the other.
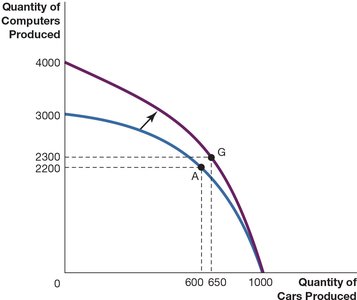
Shifts in the PPF
Economic growth or technological improvement shifts the PPF outward, allowing more of both goods to be produced.
Microeconomics vs. Macroeconomics
Microeconomics: Studies individual households and firms, and their interactions in markets.
Macroeconomics: Examines economy-wide phenomena such as inflation, unemployment, and economic growth.
The Economist as Policy Adviser
Positive vs. Normative Statements
Positive Statements: Claims that describe the world as it is; can be tested and validated.
Normative Statements: Claims that prescribe how the world should be; based on values and opinions.
Example: "Prices rise when the government increases the quantity of money" (positive) vs. "The government should print less money" (normative).
Economists in Policy Roles
Economists advise on tax policy, competition law, trade agreements, labor market policies, environmental regulations, and data analysis for policy formulation.
Policy recommendations are not always followed due to political, social, or practical considerations.
Why Economists Disagree
Disagreements arise from differences in scientific judgments (interpretation of data and models) and differences in values (normative perspectives).
Despite disagreements, economists often share consensus on many core propositions (e.g., the effects of rent controls and tariffs).
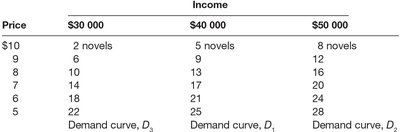
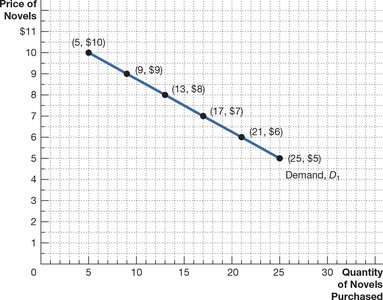
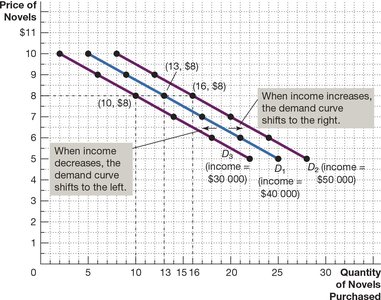
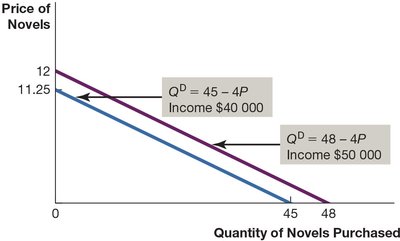
Demand Curves and Shifts
Demand curves show the relationship between price and quantity demanded, holding other factors constant.
Shifts in the demand curve occur when a variable not on the axes (e.g., income) changes.
Price | Income $30,000 | Income $40,000 | Income $50,000 |
|---|---|---|---|
$10 | 2 novels | 5 novels | 8 novels |
9 | 6 | 9 | 12 |
8 | 10 | 13 | 16 |
7 | 14 | 17 | 20 |
6 | 18 | 21 | 24 |
5 | 22 | 25 | 28 |
Demand curve, D3 | Demand curve, D1 | Demand curve, D2 |
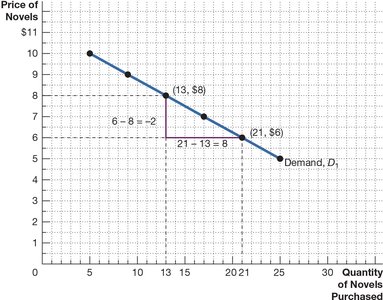
Slope and Functional Form
Slope: The slope of a line is calculated as .
For a demand curve, the slope indicates how much quantity demanded changes with price.
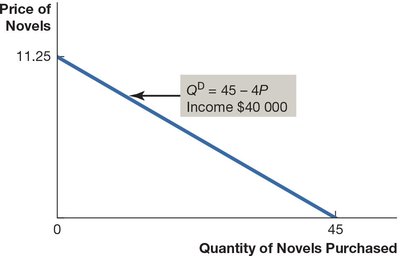
Linear Demand Function: where a and b are parameters.
Example: For Fatoula's demand curve, .
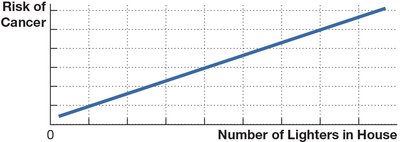
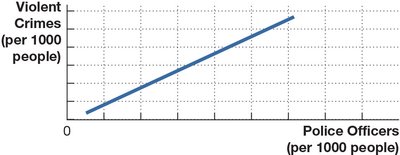
Cause and Effect in Graphs
Omitted Variable Trap: Failing to include relevant variables can lead to misleading conclusions about causality.
Reverse Causality: Correlation does not imply causation; the direction of causality must be carefully considered.
Additional info: Understanding the limitations of graphical analysis is crucial for accurate economic reasoning.
