 Back
Unemployment and Inflation: Key Macroeconomic Concepts and the Phillips Curve
Study Guide - Smart Notes
 Tailored notes based on your materials, expanded with key definitions, examples, and context.
Unemployment and Inflation: Two Macroeconomic Evils
Introduction
This study guide explores the fundamental macroeconomic issues of unemployment and inflation, their measurement, impacts, and the relationship between them as described by the Phillips curve. Understanding these concepts is essential for analyzing economic health and policy decisions.
Unemployment
Economic Impact of Unemployment
Unemployment leads to lost incomes and production, and can pause human capital accumulation through missed opportunities for on-the-job training and learning by doing. Prolonged unemployment can damage job prospects and morale. Some unemployment is inevitable, even in full-employment economies, due to the need for worker reallocation between industries or regions for efficiency.
Lost income and production: Reduces overall economic output.
Human capital stagnation: Skills may deteriorate during unemployment.
Creative destruction: Economic growth often requires shifting workers to new industries.
Inevitable unemployment: Exists even in healthy economies.
Labor Market Structure
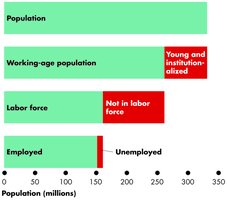
The labor market is structured hierarchically, with the total population divided into working-age population, labor force, and employed/unemployed categories. The U.S. Census Bureau surveys the civilian working-age population (16+ years, not institutionalized), which is further divided into those in the labor force and those out of it. The labor force consists of both employed and unemployed individuals.
Working-age population: People aged 16+ not in institutions.
Labor force: Sum of employed and unemployed.
Employed: Individuals currently working.
Unemployed: Individuals actively seeking work, waiting to be recalled, or waiting to start a new job.
Categories of Unemployed Workers
To be counted as unemployed, a person must meet one of the following criteria:
Without work but actively seeking employment within the past four weeks
Waiting to be recalled to a previous job
Waiting to start a new job within 30 days
Labor Market Indicators
The Bureau of Labor Statistics (BLS) reports several unemployment rates, with U3 as the headline rate. U1 through U6 progressively include more categories of un- or underemployment.
U3: Official unemployment rate
U1-U6: Broader measures including discouraged workers and underemployed
Types of Unemployment
Frictional Unemployment: Results from normal labor market turnover, such as career changes, relocations, and demographic shifts. It is a healthy sign of a dynamic economy.
Structural Unemployment: Caused by technological changes or foreign competition that alter job requirements or locations. It tends to last longer and increases the natural rate of unemployment.
Cyclical Unemployment: Occurs during recessions when GDP falls below potential, raising unemployment above the natural rate. In overheated economies, cyclical unemployment can be negative, leading to inflationary pressures.
Natural Rate of Unemployment (NAIRU): The rate at which inflation does not accelerate, estimated based on demographics, real wages, and unemployment benefits.
Inflation and Deflation
Inflation: Rising Prices
Inflation is the general increase in prices over time. It acts as a regressive tax, disproportionately affecting the poor, disrupts credit markets, and forces individuals to spend time protecting their assets. Hyperinflation can devastate economies, as seen in historical cases like Zimbabwe (2007-8), Yugoslavia (1992-3), and Germany (1921-3).
Regressive tax effect: Hurts low-income households more.
Credit market disruption: Leads to short-term lending and high interest rates.
Asset protection: Individuals seek ways to preserve purchasing power.
Hyperinflation: Extreme price increases, often above 500% or 1000% per year.
Deflation: Falling Prices
Deflation is the general decrease in prices. It is typically avoided by policymakers because it can lead to reduced spending, lower incomes, and banking crises. Not all deflationary episodes are negative, but central banks remain cautious.
Delayed purchases: Consumers wait for lower prices, reducing demand.
Revenue decline: Firms struggle to repay loans, worsening financial crises.
Historical examples: The Great Depression (1930s), Japan's "lost decade" (1990s).
Measuring Inflation: The Consumer Price Index (CPI)
Definition and Reference Base
The Consumer Price Index (CPI) measures the average price level of a fixed basket of goods and services. The reference base period (1982-1984) is set to 100. For example, a CPI of 306 in August 2023 indicates prices have more than tripled since the base period.
Constructing the CPI
Three stages are involved in constructing the CPI:
Selecting the CPI basket (based on the Consumer Expenditure Survey)
Conducting a monthly price survey
Calculating the CPI
The CPI Basket
The CPI basket reflects consumer spending patterns, with weights assigned to different categories. The most recent basket is based on the 2019 Consumer Expenditure Survey.
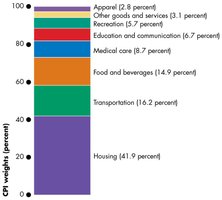
Housing: 41.9%
Transportation: 16.2%
Food and beverages: 14.9%
Medical care: 8.7%
Education and communication: 6.7%
Recreation: 5.7%
Other goods and services: 3.1%
Apparel: 2.8%
Calculating the CPI
To calculate the CPI, the cost of a fixed basket of goods is compared across periods. For example, in a simple economy with oranges and haircuts:
Base year (2021): 10 oranges at $1, 5 haircuts at $8, total cost $50
Current year (2022): 10 oranges at $2, 5 haircuts at $10, total cost $70
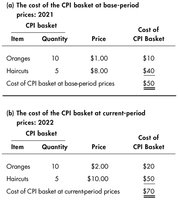
The CPI formula is:
In this example, CPI in 2022 is 140, indicating a 40% increase from the base period.
Biases in the CPI
The CPI may overstate inflation because it keeps the basket fixed, ignoring consumer substitution and quality improvements. Overstated inflation affects government transfers indexed to the CPI. The BLS has corrected much of this bias, but some remains.
Substitution bias: Consumers switch to cheaper goods.
Quality bias: CPI does not adjust for new or improved products.
Impact: Transfers like Social Security may rise faster than needed.
Nominal and Real Interest Rates
The nominal interest rate is the rate paid for money, while the real interest rate adjusts for inflation, reflecting purchasing power.
Example: If a 1-year CD pays 5% interest and inflation is 5%, the real interest rate is 0%.
The Phillips Curve
Relationship Between Unemployment and Inflation
The Phillips curve describes an inverse relationship between unemployment and inflation. Historically, this was clear in 1950-1970 data, but less so since 1970 due to factors like oil shocks, monetary policy, and technological changes. Recent inflation surges suggest the relationship may still be relevant.
Inverse relationship: High unemployment, low inflation; low unemployment, high inflation.
Historical clarity: Strong in mid-20th century, less clear in recent decades.
Modern complications: External shocks and policy changes affect the curve.
NAIRU: The non-accelerating inflation rate of unemployment, closely related to the natural rate.
