Skip to main content
Microeconomics
My Course
Learn
Exam Prep
AI Tutor
Study Guides
Flashcards
Explore
Try the app
My Course
Learn
Exam Prep
AI Tutor
Study Guides
Flashcards
Explore
Try the app
Back
Interpreting Graphs, Correlation, Causation, and Omitted Variables definitions
You can tap to flip the card.
Correlation
You can tap to flip the card.
👆
Correlation
A relationship between two variables that enables predictions based on observed patterns in their values.
Track progress
Control buttons has been changed to "navigation" mode.
1/15
Related flashcards
Related practice
Recommended videos
Interpreting Graphs, Correlation, Causation, and Omitted Variables quiz #1
Interpreting Graphs, Correlation, Causation, and Omitted Variables
10 Terms
Interpreting Graphs, Correlation, Causation, and Omitted Variables
1. Reading and Understanding Graphs
10 problems
Topic
Slope of Linear Graphs
1. Reading and Understanding Graphs
10 problems
Topic
1. Reading and Understanding Graphs
9 topics
15 problems
Chapter
Guided course
03:27
Interpreting Graphs (Part One)
3287
views
36
rank
Guided course
03:02
Interpreting Graphs (Part Two)
3365
views
77
rank
Terms in this set (15)
Hide definitions
Correlation
A relationship between two variables that enables predictions based on observed patterns in their values.
Causation
A direct link where one event or variable triggers another, forming a cause-and-effect connection.
Positive Correlation
A scenario where both variables increase or decrease together, reflecting a direct relationship.
Negative Correlation
A situation where one variable rises as the other falls, indicating an inverse relationship.
Direct Relationship
A pattern where changes in one variable are matched by similar changes in another variable.
Inverse Relationship
A pattern where increases in one variable correspond to decreases in another variable.
Graph Interpretation
The process of analyzing visual data representations to understand relationships between variables.
Omitted Variable Bias
A distortion in analysis caused by leaving out important factors, leading to misleading conclusions.
Reverse Causality
A pitfall where the effect is mistakenly identified as the cause, confusing the direction of influence.
Prediction
An estimate of future outcomes based on observed relationships between variables.
Experience
A factor that can influence outcomes, such as wages, but may be left out in simple analyses.
Pitfall
A common error or trap encountered when analyzing graphs or relationships between variables.
Variable
An element or factor whose value can change and is often represented on graph axes.
X Axis
The horizontal line in a graph, typically representing the independent variable.
Y Axis
The vertical line in a graph, usually representing the dependent variable.
 BackBack
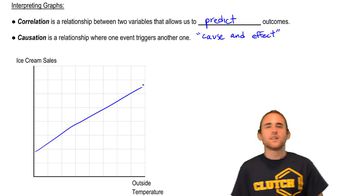
 03:27
03:27